Why Deutsche Bahn Is Late
Abstract
Deutsche Bahn’s punctuality crisis looks, from the passenger seat, like ordinary incompetence: the train is late, the platform changes, the connection is missed, the apology is ritual. The working claim of this report is harsher and more structural. DB is late because Germany is trying to run a dense national passenger, regional, and freight rail system on infrastructure that is old, overloaded, and being rebuilt while it is still in use. The economics compound the problem: DB Group is expected to serve public goals, finance and operate capital-heavy infrastructure, satisfy customers, carry freight, and recover commercial discipline, while the Federal Government remains the key owner, funder, and policy-setter. The result is a system where delays are not accidents at the edge; they are what an over-utilized network produces when resilience has been consumed.
Introduction
The popular version of the story is simple: German trains used to be punctual, and now Deutsche Bahn is a national embarrassment. That version is directionally true but analytically lazy. It treats lateness as a personality defect of an operator rather than the output of a system.
The useful question is not “Why is my train late?” It is: “What kind of rail system produces lateness as a normal result?”
This report investigates four layers:
- The operational facts: how punctual DB is, where the problem is worst, and what DB counts as punctual.
- The historical change: what happened to demand, capacity, asset condition, renewal, construction burden, and staffing since the 2000s.
- The physical system: infrastructure condition, overloaded corridors, interlockings, switches, bridges, construction, and mixed traffic.
- The network model: how a small delay becomes a national disruption.
- The geography of fragility: which hubs and corridors have the highest delay multiplier.
- The economics: DB’s revenue mix, segment results, debt, public grants, and investment model.
- The governance problem: whether DB is being asked to behave like a commercial company while carrying the consequences of public underinvestment and political delay.
- The comparator question: why Switzerland, the Netherlands, France, Spain, Italy, Japan, and China reduce delay propagation differently.
Current Working Thesis
DB is not late because Germans forgot how to run trains. DB is late because the rail network lost slack. Once a network is old, crowded, and under construction, punctuality becomes fragile: a fault in one place, a short-notice construction constraint, or a staffing gap does not stay local. It propagates through hubs and shared corridors.
That does not absolve DB management. The institution still owns execution quality, construction planning, information systems, rolling-stock reliability, staff productivity, and customer communication. But a serious explanation has to begin with the system’s constraints rather than with passenger frustration.
The article’s central empirical question is now sharper:
What changed between the period when German rail was plausibly considered punctual and the current period where DB long-distance punctuality sits around the low 60s?
The working answer is not one cause. It is an interaction:
more rail demand
+ limited capacity growth
+ aging infrastructure
+ delayed renewal
+ more construction on a live network
+ staffing and operational constraints
+ ambiguous public/commercial governance
= less slack
= more delay propagation
= worse punctuality
The point of the data work is to show each term separately and then show how they combine. The final article should make the reader see the decline as a cumulative loss of slack, not as one sudden collapse.
What We Know So Far
1. Long-distance punctuality is the visible failure
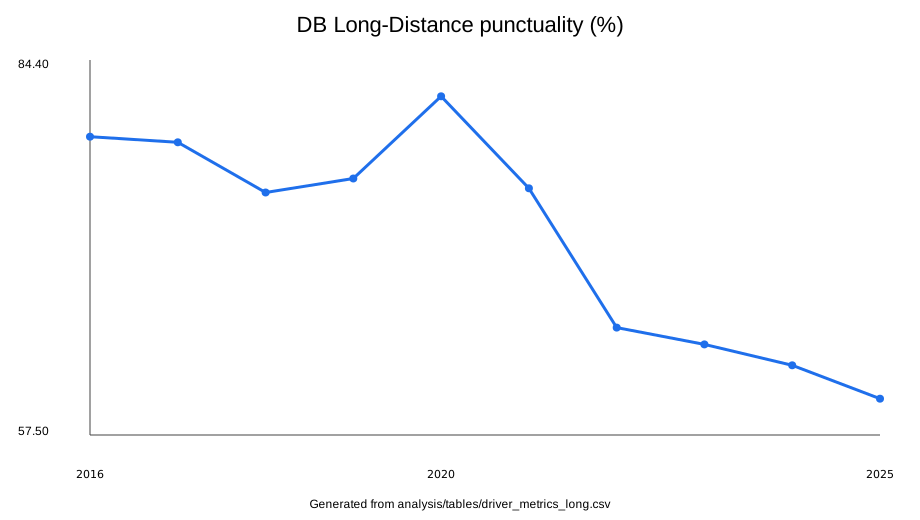
DB’s 2024 report shows long-distance punctuality at 62.5%, down from 64.0% in 2023 and 65.2% in 2022. Regional rail looked much better in the same table, at 90.7% in 2024, though this aggregate can hide local pain. DB Cargo Germany was at 68.0%.
The first half of 2025 did not produce a clean turnaround. DB’s interim report says punctuality in German rail continued to decline despite intensive operational-quality management.
The Federal Government’s 2025 customer-satisfaction agenda is more blunt: long-distance punctuality was 59.6% in August 2025, about 20 percentage points below the 2016 figure of 78.9%, and for three consecutive days in late June/early July 2025 less than 40% of long-distance services were on time.
2. DB’s own cause list is structural
DB’s 2025 interim report identifies the main causes as:
- poor condition of facilities;
- intensive construction activity;
- high traffic density in hubs such as Hamburg, Frankfurt am Main, and Cologne;
- staff shortages in key operational roles;
- disruptive events that cascade when they hit critical hubs or lines.
That list matters because it is not a customer-service list. It is a capacity, asset-condition, labor, and network-resilience list.
3. Construction is both medicine and poison
The rail network needs modernization, but modernization itself restricts capacity. DB says intensive construction in 2024 and the first half of 2025 created capacity restrictions, critical route-utilization levels, and additional delays. Short-notice construction requirements made operational quality worse.
This is the repair paradox: DB must close and restrict the network to fix the network, but each restriction worsens reliability while the work is happening. A system with ample spare capacity can absorb that. A saturated network cannot.
4. The infrastructure company is now explicitly “common good-oriented”
DB InfraGO has been DB Group’s common-good-oriented infrastructure subsidiary since the end of 2023, after DB Netz was renamed and DB Station&Service was merged into it. The intent is to manage track and station infrastructure from one source and improve quality, capacity, and stability.
That reform is an admission that the old structure was not delivering. It also clarifies the economics: rail infrastructure is not just a DB business unit; it is a public asset with political, climate, regional, and industrial goals.
5. DB’s economics are not a simple farebox story
In 2024 DB Group adjusted revenues from continuing operations were EUR 26.227 billion. The adjusted external revenue mix was roughly:
| Segment | Share of adjusted external revenues, 2024 |
|---|---|
| DB Regional | 38.5% |
| DB Long-Distance | 21.6% |
| DB Cargo | 19.3% |
| DB InfraGO | 11.6% |
| DB Energy | 5.7% |
| Other | 3.3% |
Most revenue is Germany-facing. DB’s report shows EUR 24.970 billion of adjusted external revenues in Germany in 2024, compared with EUR 1.103 billion in Europe excluding Germany and EUR 154 million in the rest of world.
The income statement is weak. DB Group’s 2024 operating income (EBIT) was EUR -634 million. The adjusted EBIT target under the S3 restructuring program is about EUR 2 billion by 2027, compared with EUR -0.3 billion in 2024.
6. Public grants are central to infrastructure economics
DB says the Federal Government is the key funder of rail infrastructure under Germany’s constitutional infrastructure mandate. Public-sector investment grants for rail infrastructure are generally non-repayable and are deducted from asset acquisition/manufacturing costs in DB’s accounting. In 2024, additional federal equity funds for infrastructure amounted to EUR 5.5 billion, and the 2025 federal budget included EUR 8.314 billion for equity increases plus a EUR 3 billion loan for the federal rail network.
In 2025, about EUR 23.1 billion was planned for expansion, renewal, and maintenance of network, stations, and energy facilities.
This means the economics of DB cannot be understood like an airline or bus company. The core asset base is a public infrastructure system, and the funding model directly shapes reliability.
Reproducible Metrics Track
The article needs a dedicated empirical section: “What changed?”
The measurable story should be built from annual time series, ideally from 2000-present. The first reproducible data spine is:
| Driver | Metric | Current reproducibility status |
|---|---|---|
| Outcome | DB Long-Distance, Regional, and Cargo punctuality | DB KPI CSV covers 2016-2025; older years need annual-report extraction |
| Demand | passengers, passenger-km, freight tonne-km, train-km | DB KPI covers DB from 2016-2025; Eurostat gives German market context from roughly 2004 onward |
| Capacity | rail line length, double/multiple-track length, electrification | Eurostat network dataset downloaded by script |
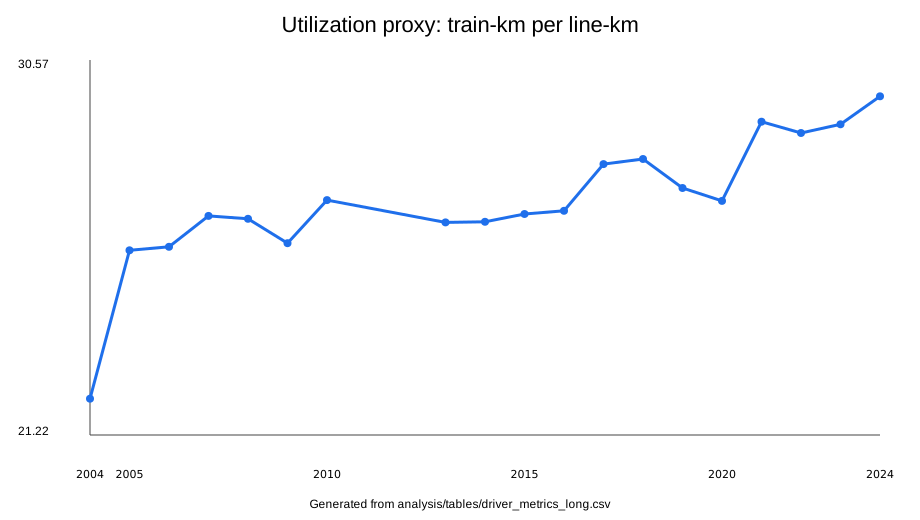
| Utilization | train-km per line-km proxy | derived from Eurostat train-km and line-km |
| Asset condition | total-network condition grade, high-performance-network condition grade | DB KPI covers recent years; InfraGO PDF adds more detail |
| Construction / degraded infrastructure | restricted-speed sections, construction-related delays where available | DB KPI includes restricted-speed sections and infrastructure-related delay lost units |
| Renewal effort | modernized track-km, old interlockings replaced, DB InfraGO capex | DB KPI CSV covers 2016-2025 |
| Staffing / operational capacity | DB InfraGO employees, operations/maintenance staffing where available | DB KPI has business-unit staff; more specific roles need additional sources |
The first chart set already exists under analysis/figures/:
| Chart | Article role |
|---|---|
punctuality_long_distance_pct.svg | Shows the visible outcome: long-distance punctuality declined from 78.9% in 2016 to 60.1% in 2025 in the DB KPI CSV. |
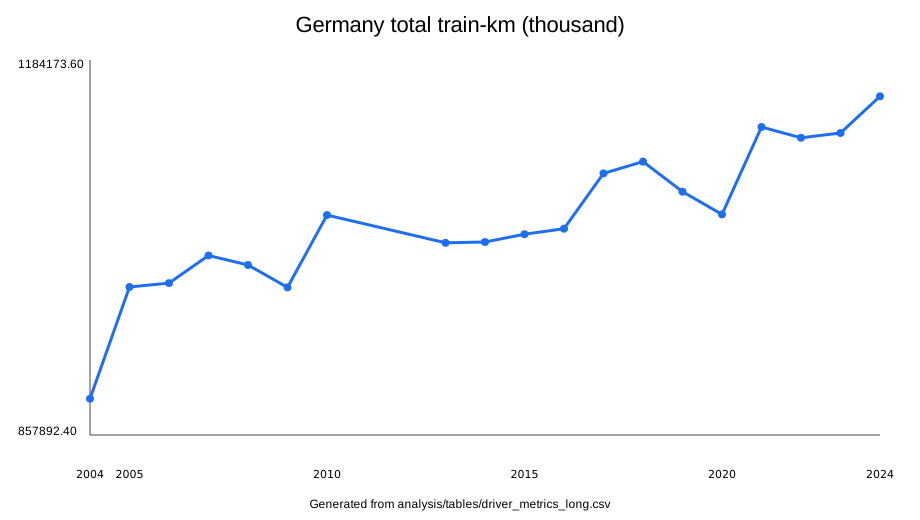
germany_total_train_km_thousand.svg | Shows whole-market traffic pressure from Eurostat train-km. |
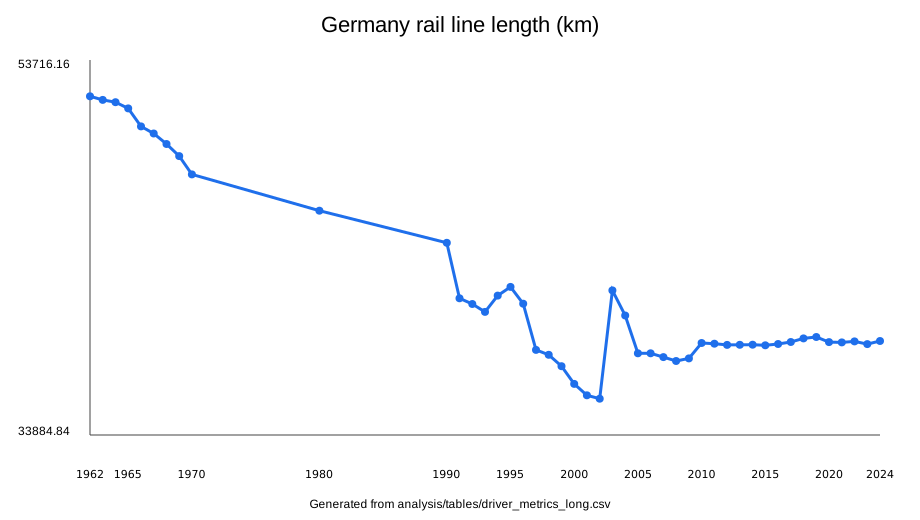
germany_total_rail_line_km.svg | Shows whether physical line length kept pace with traffic. |
utilization_proxy_train_km_per_line_km.svg | Shows the pressure ratio: train-km per line-km. |
infrastructure_related_delays_lost_units_per_day.svg | Shows DB’s infrastructure-delay burden in the KPI source. |
condition_grade_total_network.svg | Shows asset condition as reported by DB InfraGO. |
condition_grade_high_performance_network.svg | Shows whether the most important network is in worse shape than the average. |
restricted_speed_sections_avg_per_day.svg | Shows degraded infrastructure in operation. |
modernized_track_km_cumulative.svg | Shows renewal effort. |
old_interlockings_replaced_cumulative.svg | Shows progress on one failure-prone asset class. |
gross_capex_db_infrago_eur_m.svg | Shows the late ramp-up in infrastructure spending. |
The current generated figures:
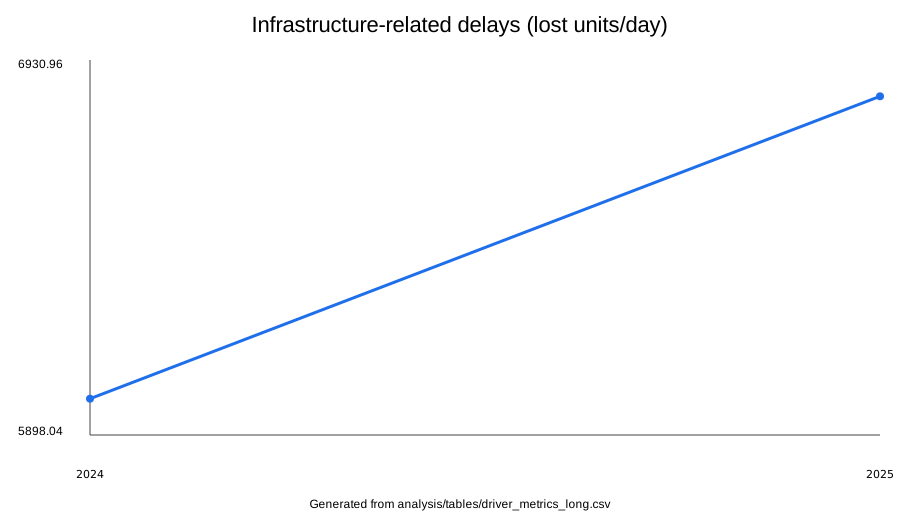
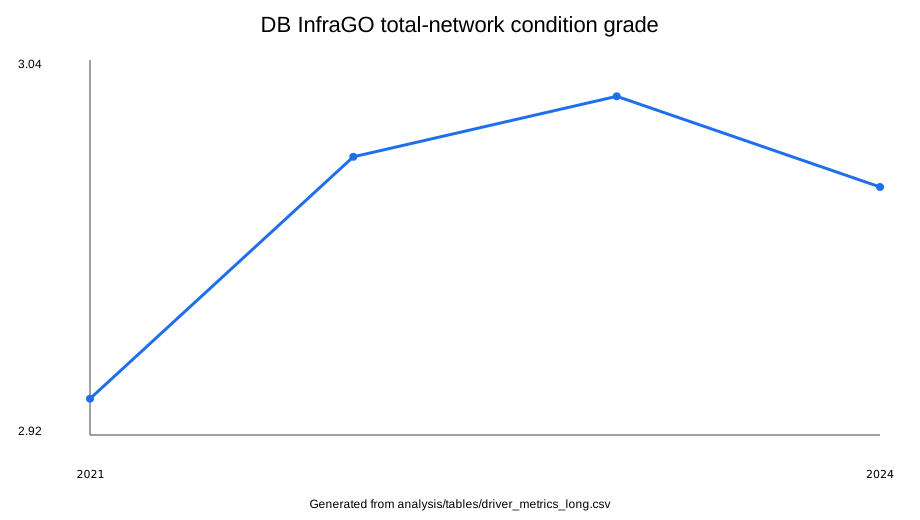
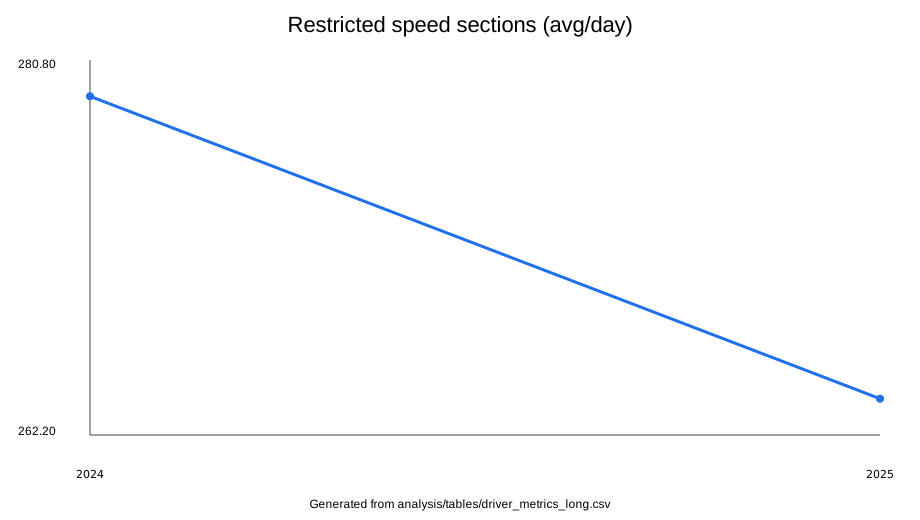
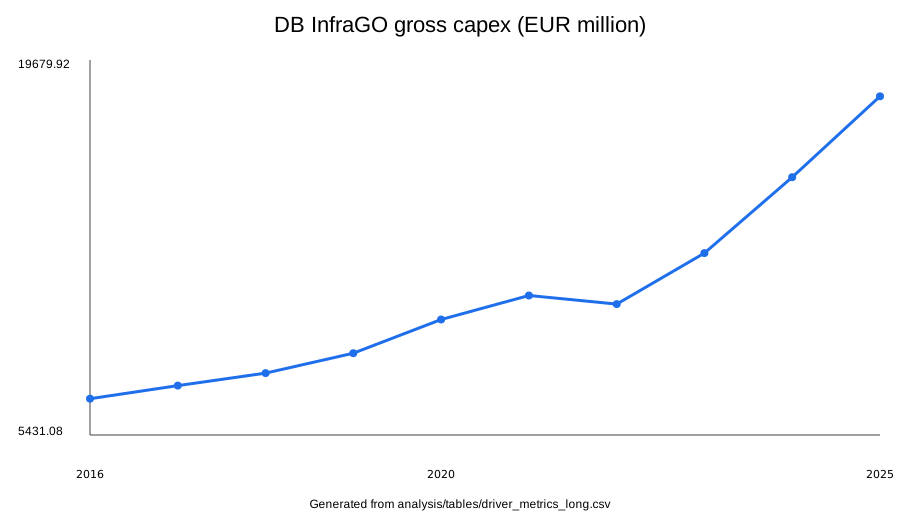
The reader-facing structure should be:
- Outcome: punctuality falls.
- Demand: more rail activity presses on the system.
- Capacity: line length and practical capacity do not rise enough.
- Utilization: train-km per line-km rises or stays high.
- Asset condition: condition grades and restricted-speed sections reveal fragility.
- Renewal: modernization and capex rise, but mostly after reliability has already deteriorated.
- Construction burden: the repair process itself consumes capacity.
- Aggregate: the composite network-pressure index should summarize why the same primary fault now produces more delay than it used to.
The scripts created for this workstream are:
analysis/scripts/download_sources.py: captures registered sources intodata/raw/with hashes.analysis/scripts/fetch_db_kpi.py: downloads and normalizes DB’s annual KPI CSV.analysis/scripts/fetch_eurostat.py: downloads and normalizes Eurostat rail demand, train movement, and network datasets.analysis/scripts/build_driver_metrics.py: builds source-linked driver metrics.analysis/scripts/plot_driver_metrics_svg.py: creates dependency-free SVG charts.analysis/scripts/estimate_seed_model.py: defines the OLS interface but refuses to run until a real model panel exists.
The first econometric model should not pretend to prove causality. It should test whether the proposed story is numerically coherent:
punctuality_t =
  beta_0
  + beta_1 utilization_t
  + beta_2 asset_condition_t
  + beta_3 renewal_spend_lagged_t
  + beta_4 construction_burden_t
  + beta_5 staffing_t
  + error_t
The better version is a corridor-year panel:
delay_or_punctuality_{corridor,year} =
  corridor fixed effects
  + year fixed effects
  + utilization_{corridor,year}
  + construction_{corridor,year}
  + asset_condition_{corridor,year}
  + renewal_{corridor,year-lag}
  + traffic_mix_{corridor,year}
  + error
The corridor model is the real target because DB’s failure is not spatially uniform. A national annual series can show the timing of decline; a corridor panel can show whether saturated, old, under-renewed, construction-heavy corridors explain the delay pattern.
This section should be honest about reproducibility. DB’s KPI CSV gives a solid 2016-2025 backbone. Eurostat gives whole-Germany context back toward 2004. A complete 2000-present story still needs extraction from older DB annual reports. The econometric script therefore refuses to run until there is a real model panel; the article should not present regression coefficients until that panel exists.
How Delays Propagate
The right model is not “one delayed train.” The right model is a time-expanded network.
In the simplest version:
- Nodes are stations, junctions, depots, platform tracks, interlockings, and maintenance/construction constraints.
- Edges are track sections with capacity, speed, signalling headways, and route conflicts.
- Trains are agents moving through that graph according to a timetable.
- Slack is the difference between scheduled time and minimum feasible time: running-time padding, dwell-time padding, turn-around time, platform margin, crew margin, rolling-stock margin, and connection margin.
- Conflicts occur when two trains need the same scarce resource at overlapping times: a track section, platform, switch throat, junction movement, crew, trainset, or path through a construction zone.
- Dispatching rules decide which train gets priority when the plan breaks.
A primary delay becomes a propagated delay when the affected train consumes slack that another train needed. The mechanisms are concrete:
- Headway conflict. A late train misses its planned slot and enters a section close to another train. The following train must slow, stop, or be resequenced.
- Junction conflict. A late movement through a junction blocks crossing or merging movements that were conflict-free in the timetable.
- Platform conflict. A late train occupies a platform needed by another service, especially in terminal or constrained hub stations.
- Rolling-stock rotation. The trainset arrives late and its next service starts late unless there is spare rolling stock or the next service is cancelled/short-turned.
- Crew rotation. A driver or onboard crew member misses the next booked duty, forcing delay, substitution, or cancellation.
- Connection protection. Holding one train for passengers delays another train and can propagate delay deliberately.
- Construction constraint. Temporary single-track working, speed restrictions, or night closures reduce available paths; the same primary delay then has less room to be absorbed.
- Freight/passenger interaction. Slower freight and faster passenger trains sharing scarce paths create overtaking and sequencing conflicts.
The important variable is not the initial delay alone. It is the initial delay multiplied by the local network’s lack of absorbency. A ten-minute delay on a lightly used line with long turnarounds may disappear. A ten-minute delay near Frankfurt, Cologne, Hamburg, Mannheim, or another saturated junction can become a system event.
A Practical Impact Model
For this article, a useful first model is:
Propagation risk at location L =
  primary delay probability(L)
  x traffic volume(L)
  x utilization(L)
  x conflict density(L)
  x downstream centrality(L)
  x rolling-stock/crew coupling(L)
  x construction restriction factor(L)
  x inverse slack(L)
This is not yet a calibrated equation. It is a research frame. Each term points to measurable data:
| Variable | What it means | Possible measurement |
|---|---|---|
| Primary delay probability | How often disruption starts there | incident, infrastructure-fault, weather, signal, switch, rolling-stock, and staffing delay logs |
| Traffic volume | How many trains use it | trains per day by service type |
| Utilization | How close it runs to capacity | timetable compression, UIC 406-style capacity analysis, train paths per hour vs practical capacity |
| Conflict density | How many movements compete for scarce resources | junction conflicts, platform occupancy, merges, flat crossings, single-track sections |
| Downstream centrality | How many other trips depend on it | graph betweenness, number of downstream services, passenger flows, freight flows |
| Coupling | Whether one late service delays later services | rolling-stock turns, crew turns, protected connections |
| Construction factor | Temporary loss of capacity | closures, speed restrictions, diversion-route limits |
| Inverse slack | How little margin exists | running-time buffer, dwell buffer, turn-around buffer, recovery time |
Given a delay in a specific area, the prediction task is:
- Identify the delayed train or blocked infrastructure element.
- Map all trains scheduled to use the same constrained resources during the disruption window.
- Apply dispatching priority rules and temporary operating constraints.
- Estimate how much slack each affected service has before it transfers delay onward.
- Follow trainset, crew, and passenger-connection dependencies for the next several cycles.
- Stop the propagation tree when delay is absorbed, services are cancelled, or the operational day ends.
The output should be a fan-out curve:
| Time after incident | Directly affected trains | Secondary affected trains | Passenger-minutes lost | Critical dependencies |
|---|---|---|---|---|
| 0-30 min | TBD | TBD | TBD | same section/platform |
| 30-90 min | TBD | TBD | TBD | junction resequencing, missed paths |
| 90-240 min | TBD | TBD | TBD | rolling-stock/crew turns, missed connections |
| 240+ min | TBD | TBD | TBD | network recovery or service cancellations |
How To Identify Critical Areas
The most critical areas are not simply the busiest. They are the places where volume, low slack, and high centrality meet.
The ranking should combine:
- Betweenness centrality: how often shortest/fastest rail paths pass through the area.
- Service diversity: whether long-distance, regional, S-Bahn, and freight all share the same infrastructure.
- Conflict topology: whether many movements cross or merge at grade.
- Substitutability: whether credible diversion routes exist and how much capacity those routes have.
- Recovery capacity: whether there are turn-back points, spare platforms, overtaking tracks, sidings, and crew/rolling-stock reserves.
- Failure history: whether infrastructure faults and delay minutes are concentrated there.
- Construction exposure: whether the area is inside or adjacent to a high-performance corridor renewal.
This reframes the next research task. Instead of only asking “Which lines are late?”, ask: “Which locations have the highest delay multiplier?”
Preliminary Critical Hotspot Ranking
This ranking is not final. It is the first article-facing version of the bottleneck analysis. A corridor is high priority when it combines traffic volume, network centrality, mixed traffic, low spare capacity, weak diversion options, poor asset condition, and heavy construction exposure.
| Rank | Hotspot | Why it is sensitive | What still has to be verified |
|---|---|---|---|
| 1 | Riedbahn / Frankfurt-Mannheim | More than 300 trains/day; every seventh DB long-distance train uses it; failures affect the whole network; formally overloaded PEK evidence. | Post-renovation punctuality and delay-propagation data. |
| 2 | Cologne core / Hohenzollern Bridge / Cologne Hbf-Messe/Deutz | Extreme node bottleneck; PEK evidence indicates 871 trains/day across bridge routes in 2020. | Current delay-minute concentration and updated traffic counts. |
| 3 | Rhine-Ruhr axis: Cologne-Muelheim-Duesseldorf-Duisburg-Essen-Dortmund | Formally overloaded corridor; dense long-distance, regional, S-Bahn, and freight interactions. | Full S-Bahn/local-track inclusion and current propagated-delay data. |
| 4 | Hamburg node | DB/PEK material identifies very high loads around Hamburg Hbf and approaches. | Platform occupation, junction conflicts, and delay propagation around Hamburg Hbf. |
| 5 | Hamburg-Hanover / Uelzen-Stelle-Lueneburg | DB states up to 147% utilization; key passenger and international freight corridor; major works scheduled. | Whole-corridor train counts and works impact. |
| 6 | Fulda-Hanau / Kinzigtalbahn and Frankfurt approaches | DB InfraGO says Fulda-Hanau is 160% utilized and has overaged/failure-prone assets. | Corridor-specific trains/day, asset age, and delay contribution. |
| 7 | Lehrte-Berlin / Hanover-Berlin | DB InfraGO lists more than 500 trains/day: 279 regional, 135 long-distance, 90 freight. | Utilization and propagation into Hanover/Berlin nodes. |
| 8 | Frankfurt-Heidelberg / Main-Neckar-Bahn / Darmstadt node | Up to 300 trains/day and important freight role; Darmstadt must remain operable during works. | PEK-level train mix and conflict analysis. |
| 9 | Munich-Rosenheim / Rosenheim-Salzburg / Brenner approach | International freight/passenger axis; renovation was rephased because of traffic complexity. | Official trains/day and utilization. |
| 10 | Stuttgart-Ulm / Filstalbahn and southern approaches | Included in high-performance corridor program and TEN-T relevant. | Trains/day, utilization, and corridor-specific delay data. |
The article’s test is not merely whether DB knows these places matter. The test is whether attention is proportional to criticality:
| Attention question | Why it matters |
|---|---|
| Is the hotspot in the high-performance network or another funded corridor program? | Shows whether DB’s investment map matches the delay-multiplier map. |
| Is renewal scheduled before failure risk becomes unacceptable? | Late renewal can temporarily worsen reliability because repairs then happen on an already saturated network. |
| Does the work add resilience or only replace like-for-like assets? | Crossovers, overtaking options, ETCS, platform flexibility, and diversion capacity matter for recovery. |
| Is there a pre-planned degraded-mode timetable? | Planned disruption modes beat improvisation. |
| Can passenger and freight traffic be diverted without overwhelming neighbors? | A closure is only manageable if the alternative route has spare capacity. |
| Does DB publish before/after delay and passenger-impact metrics? | Without outcome transparency, “modernization” cannot be evaluated as reliability policy. |
What DB Appears To Be Doing About Sensitive Areas
DB and the Federal Government’s main mitigation strategy is the high-performance corridor program: DB InfraGO says more than 4,000 route kilometers in 40 corridors are to be modernized, with the most heavily used corridors prioritized. DB says about a quarter of all trains currently run through this network. The logic matches the propagation model: fix the corridors where a local fault has national consequences.
The stated mitigation measures include:
- bundled corridor renewals rather than endless small works;
- additional switches, signals, overtaking opportunities, and track-change facilities;
- station modernization and better passenger information;
- ETCS/digital signalling to increase capacity on existing infrastructure;
- planned diversion routes and replacement services during major closures;
- fee discounts or compensation mechanisms for operators whose train paths are affected by general-renewal diversions.
The open question is whether this protects the sensitive areas during the transition or merely repairs them after years of accumulated fragility. Full blockades can be operationally cleaner than rolling construction, but they transfer pressure to diversion routes, road replacement services, freight paths, and neighboring corridors. The mitigation strategy therefore needs to be evaluated not only by the rebuilt corridor’s condition after reopening, but by total system delay during the closure and the speed of recovery afterward.
What Happens When A Critical Area Closes
The default operational menu appears to be:
- Reroute trains over diversionary corridors if capacity exists.
- Cancel or thin services where no reliable path exists.
- Short-turn services before the blocked area to preserve partial service.
- Replace regional traffic by buses where rail substitution is not feasible.
- Change stopping patterns to reduce conflicts or preserve long-distance paths.
- Prioritize traffic classes according to dispatching rules and operational urgency.
- Accept freight displacement when passenger recovery takes priority, unless contractual or capacity constraints prevent it.
This is exactly why criticality matters. A closure is manageable when alternative paths have spare capacity and when rolling-stock/crew rotations can be decoupled. It becomes a national reliability event when the blocked area is central, heavily utilized, and weakly substitutable.
What DB Does To Mitigate Delay
DB’s mitigation stack is mostly “recover in a saturated mixed network while rebuilding it.” That is a hard operating problem. The current tools are real, but many are tactical rather than structural.
| Mitigation | What DB does | Assessment |
|---|---|---|
| Dispatching and rerouting | Operations management can resequence, slow/speed, reroute, or assign different paths during disruption. Digital Rail Germany is developing AI-supported capacity and traffic management. | Necessary, but dispatchers cannot recover a timetable with no spare paths, no platform margin, and no overtaking flexibility. |
| Corridor renewals | The high-performance corridor program concentrates renewals, often through major closures, instead of repeating small works indefinitely. | Strategically right, but closures push pressure onto diversion routes and can worsen punctuality during the transition. |
| ETCS and digital rail | Digital interlockings, ETCS, and automation are long-run capacity and reliability levers. | Useful if tied to concrete capacity and timetable outcomes, not as technology branding. |
| Extra switches, signals, and overtaking options | Renewals can add crossovers, switches, denser signalling, and overtaking opportunities. | Directly addresses Germany’s lack of recovery margin, but requires disruptive works first. |
| Replacement timetables and bus substitution | Major corridor works use substitute buses, timetable changes, alternative routes, and passenger information. | Helps during planned works; does not solve normal-day propagation on saturated infrastructure. |
| Passenger information | DB Navigator and other systems provide alternatives and real-time updates. | Reduces passenger harm, but does not reduce primary delay minutes. |
| Passenger rights and flexible onward travel | Significant expected delay can allow passengers to use other routes or trains. | Individual mitigation; it can shift demand onto later trains. |
The practical missing piece is not one miracle technology. It is a reliability discipline:
- publish connection punctuality and passenger-arrival punctuality as headline metrics;
- design renewals around operating flexibility, not only asset replacement;
- build degraded-mode timetables for critical corridors before incidents occur;
- use ETCS where it unlocks a measurable service plan;
- separate fast/slow and passenger/freight flows at the worst bottlenecks;
- measure recovery time after disruption, not only arrival punctuality.
Comparator Systems: What Better Railways Do Differently
Cross-country punctuality comparisons are dangerous because definitions differ: five-minute thresholds, six-minute thresholds, fifteen-minute thresholds, cancelled-train treatment, passenger-weighted vs train-weighted figures, and high-speed-only vs whole-network figures can all change the ranking. The comparison should focus first on system design.
| System | Structural difference from Germany | Why it may reduce delay propagation |
|---|---|---|
| Switzerland | Integrated national clockface timetable, intense connection planning, high investment per capita, and explicit connection punctuality reporting. | The system is designed around reliable transfers and recovery, not just individual train arrivals. |
| Netherlands | Dense passenger network with strong operational control and annual reporting of main-rail punctuality. | High density remains risky, but the network is smaller, more passenger-focused, and easier to manage as an integrated operating problem. |
| France | TGV services use more dedicated high-speed infrastructure radiating from Paris; conventional and high-speed systems are more separated than in Germany. | Fewer interactions between very fast intercity trains, regional traffic, and freight on the same tracks. |
| Spain | Large high-speed network with many passenger-dedicated lines and strong separation from legacy Iberian-gauge/mixed traffic. | Dedicated high-speed corridors reduce freight/regional conflicts and permit more controlled operations. |
| Italy | High-speed corridors are more distinct from conventional traffic, with competition on some routes and concentrated intercity demand. | Fast services have fewer interactions with slow services than in a mixed, polycentric German network. |
| Japan | Shinkansen is operationally segregated, standardized, intensely maintained, and managed with very tight operating discipline. JR Central reports Tokaido Shinkansen average delay of 1.4 minutes per train in FY2024, including natural-disaster delays. | Dedicated infrastructure and standardized rolling stock reduce conflict types; disruptions do not propagate as easily into conventional mixed traffic. |
| China | Massive passenger-dedicated high-speed network built recently at scale, with long-distance passenger flows shifted to new high-speed corridors. | Newer infrastructure and passenger-dedicated high-speed lines reduce legacy-network conflicts, though debt, utilization, and regional economics are separate questions. |
The lessons are concrete:
| Comparator lesson | What Germany can take from it |
|---|---|
| Switzerland measures connections, not just trains. | DB should make connection punctuality and passenger arrival punctuality headline targets. |
| Netherlands treats the passenger journey as the KPI. | DB should track passenger-minutes lost, not only train punctuality. |
| France uses targeted ERTMS where it increases a known high-speed bottleneck’s peak capacity. | Germany should tie ETCS to corridor-level capacity and robustness outcomes. |
| Spain and China built large passenger-dedicated HSR capacity. | Germany cannot copy the geography, but can separate flows at bottlenecks and build selective new capacity. |
| Italy’s open-access high-speed competition works on dense corridors with capacity. | Competition helps where infrastructure can absorb it; it does not solve saturated mixed corridors. |
| Japan’s Shinkansen is operationally simple and segregated. | Structural simplicity is the strongest delay-propagation reducer. |
The key difference is not “culture.” Culture may matter at the margin, but the engineering and institutional differences are more important:
- Dedicated vs mixed infrastructure. Japan, Spain, China, France, and Italy separate a larger share of high-speed passenger traffic from freight and regional traffic. Germany runs much of its long-distance system through mixed corridors.
- Network geometry. Germany is polycentric: Berlin, Hamburg, Cologne, Frankfurt, Munich, Stuttgart, Mannheim, Hanover, Leipzig, and the Ruhr all matter. France is more radial around Paris; Spain’s high-speed network is heavily Madrid-centered. Polycentric networks create more interacting flows.
- Slack and recovery design. Switzerland’s reputation is not just punctual arrivals; it is connection reliability. That requires explicit slack, transfer design, and operational discipline.
- Asset age and renewal backlog. Japan’s Shinkansen and China’s HSR show what happens when high-speed operations run on purpose-built systems with rigorous maintenance. Germany’s crisis is concentrated in a legacy mixed-use network being modernized late.
- Construction strategy. Better systems either built new high-speed capacity away from the old network or protected critical corridors before they became fragile. Germany is now trying to rebuild critical corridors under live-network pressure.
- Governance and accountability. Comparator systems differ in ownership and market design, so privatization alone is not the explanation. The relevant question is whether the institution that controls infrastructure also has stable funding, clear reliability goals, and credible authority to protect capacity.
This comparison should sharpen the article’s argument: DB’s problem is not that Germany lacks railway knowledge. It is that Germany’s long-distance rail operates inside a highly connected, mixed, capacity-constrained legacy network. Other systems reduce propagation by separating traffic, preserving slack, simplifying network interactions, or building new dedicated infrastructure.
Governance And Competition
DB’s federal ownership is not, by itself, the clean explanation. Switzerland and Japan show that public or tightly coordinated railway systems can work extremely well. The stronger governance question is whether Germany has the wrong bundle of responsibilities and incentives.
DB is a federally owned, vertically integrated group: infrastructure, stations, long-distance passenger, regional passenger, freight, sales channels, and data all sit inside one corporate perimeter. That has coordination benefits. It also creates weak accountability and recurring conflicts:
- DB InfraGO must serve DB operators and DB competitors fairly while still belonging to DB Group.
- Infrastructure funding depends heavily on the Federal Government, but operational failure is experienced as DB failure.
- Commercial accounting coexists with public-service expectations.
- Competition can reduce fares and improve service on corridors with capacity, but competition cannot create paths where the infrastructure is saturated.
- Separation can improve neutrality, but excessive fragmentation can make disruption recovery and passenger accountability worse.
The article should therefore avoid both slogans:
- not “privatize DB and the problem disappears”;
- not “competition is irrelevant because rail is a natural monopoly.”
The better claim is:
Germany needs accountable infrastructure governance, stable funding, quality-linked regulation, transparent path allocation, and strong coordination before it needs an ideological ownership fight.
The competition question should be tested in layers:
- Would an independent infrastructure manager make maintenance quality and access neutrality clearer?
- Would multiple passenger and freight operators improve service where capacity exists?
- Would competition worsen scarce-capacity conflicts at bottlenecks?
- Could the Deutschlandticket be redesigned as a voucher-like user subsidy while preserving integrated pricing?
- Do German regional tenders already provide evidence on whether non-DB operators perform better on comparable routes?
The ownership models imply different failure modes:
| Model | What it improves | What it can break |
|---|---|---|
| Integrated state railway | Coordination of timetable, track, stations, disruption response, and long-term public goals. | Opaque cross-subsidy, weak access neutrality, political-accountability blur. |
| Independent infrastructure manager with access charges | Cleaner neutrality and clearer infrastructure KPIs. | Coordination costs and fragmented passenger accountability. |
| Competing passenger/freight operators | Lower fares, more frequency, and innovation where capacity exists. | Cherry-picking, scarce-capacity conflicts, and higher coordination demands. |
| Concession/franchise model | Competition for the market where open access is weak. | Rigid contracts, subsidy dependence, and contract gaming. |
| Voucher-like ticketing | Keeps public affordability support while letting operators compete. | Does not create capacity and weakens the direct fare-revenue signal. |
So the governance conclusion should be conditional: vertical separation may improve neutrality and accountability, but only if it is paired with stable funding, quality-linked regulation, transparent capacity allocation, and strong coordination. A fragmented railway with the same old bottlenecks would still be late.
Provisional Findings
These are not final findings yet. They are claims to test in the next pass.
| Claim | Evidence | Confidence |
|---|---|---|
| Long-distance services are the punctuality crisis the public experiences most sharply. | DB 2024 punctuality table: long-distance 62.5%, regional 90.7%, cargo Germany 68.0%. Federal agenda: 59.6% long-distance punctuality in August 2025. | High |
| Infrastructure condition is a primary cause, not a secondary excuse. | DB 2024 and 2025 reports directly name outdated/overloaded facilities, old interlockings, superstructure faults, bridges, and restricted-speed sections. | High |
| Construction currently worsens punctuality even when it is necessary for long-run recovery. | DB identifies intensive construction and short-term construction planning as causes of delay in 2024 and H1 2025. | High |
| Hubs create delay propagation. | DB specifically names growth concentrated in already highly utilized hubs such as Hamburg, Frankfurt, and Cologne, with overloads transferred to the entire network. | High |
| DB’s financial problem is linked to quality failure. | DB’s S3 program explicitly combines infrastructure, operations, and profitability; the profitability pillar says many business areas are in the red partly due to the quality crisis in infrastructure and operations. | Medium |
| Governance is part of the causal chain. | DB InfraGO reform, federal funding dependence, and Bundesrechnungshof criticism all point to a structural owner/funder/operator problem. Needs fuller German-source review. | Medium |
| ”Privatization” alone is too simple as an explanation. | DB remains federally owned; the issue is better framed as corporatized public infrastructure with mixed commercial and public-service mandates. Needs historical review of 1994 rail reform and IPO-era incentives. | Medium |
| Delay propagation should be modeled as a network-capacity problem, not as isolated late trains. | Railway delay-propagation literature emphasizes buffer time, timetable robustness, infrastructure constraints, route conflicts, and downstream dependencies. DB’s own cause list names hubs, high traffic density, construction, and infrastructure condition. | High |
| Critical areas are the locations with the highest delay multiplier, not merely the busiest lines. | Network centrality, conflict density, utilization, low slack, and weak diversion capacity jointly determine propagation risk. Needs DB-specific data to rank locations. | Medium |
| Better-performing systems often reduce propagation through segregation, slack, or simpler operating geometry. | Switzerland reports connection punctuality, Japan’s Shinkansen is dedicated/standardized, Spain/France/Italy/China rely more on passenger-dedicated high-speed corridors. Definitions differ, so this is a structural comparison first. | Medium |
| The measurable “what changed” story can be tested as demand growth plus limited capacity growth plus worse asset condition plus construction burden producing lower punctuality. | DB KPI CSV and Eurostat tables now provide a reproducible 2016-2025/2004-present data spine; older DB reports are needed for 2000-2015. | Medium |
| The most important bottlenecks are not only the busiest corridors but the places with the highest delay multiplier. | Preliminary PEK/DB evidence points to Riedbahn, Cologne core, Rhine-Ruhr, Hamburg, Hamburg-Hanover, Fulda-Hanau, Lehrte-Berlin, Frankfurt-Heidelberg, Munich-Rosenheim, and Stuttgart-Ulm. | Medium |
| DB’s current mitigation strategy is directionally right but late and capacity-constrained. | High-performance corridor renewals, digital rail, rerouting, replacement timetables, and passenger information exist, but transition works can worsen short-run reliability. | Medium |
| DB’s ownership structure is a governance problem only through mechanisms: maintenance incentives, access neutrality, accountability, funding stability, and coordination. | Comparator systems show both integrated and separated models can work or fail. The article should not reduce the issue to public vs private ownership. | Medium |
Discussion Direction
The opinionated argument should probably be:
DB’s crisis is what happens when a country treats rail as a climate policy, regional-development tool, freight backbone, public-service guarantee, and commercial company at the same time, without maintaining enough physical and financial slack for that system to work.
The target should not be a cheap “DB bad” essay. The stronger piece is a systems essay:
- A railway is not punctual because everyone tries hard.
- It is punctual when the infrastructure has reserve capacity, maintenance is boring, assets are renewed before failure, traffic is separated enough to prevent cascade effects, and construction is planned years ahead.
- Germany appears to be rebuilding that discipline after letting it erode.
- The open question is whether the current investment and governance reforms are enough, or whether they merely stop the decline.
- DB should be evaluated against a bottleneck map: the highest-delay-multiplier corridors should receive the earliest and most resilience-oriented interventions.
- Competition is not a substitute for infrastructure capacity. It can improve prices and service where capacity exists; it can worsen conflict where capacity is scarce.
Limitations
- The first pass relies heavily on DB and government sources; those are essential but self-interested.
- Monthly 2025/2026 punctuality figures need a primary time-series source before being used as trend evidence.
- Regional passenger experience may be worse than aggregate DB Regional punctuality suggests; local network data is needed.
- The economics of DB Cargo, DB Long-Distance, and DB Regional need fuller segment analysis before assigning causal weight.
- The 1994 rail reform and aborted IPO history need separate sourcing before being used as a central explanation.
- International comparisons with Switzerland, Austria, France, Japan, or the UK should not be used casually; measurement definitions differ.
- The delay-propagation model is currently conceptual. It needs train-level delay data, timetable data, infrastructure topology, dispatching rules, and rolling-stock/crew rotations before it can predict the impact of a specific incident.
- Comparator systems are not uniformly “better” across every service class. A high-speed benchmark may hide weak regional services, and a national punctuality figure may hide missed connections or cancellations.
- The hotspot ranking is preliminary and uses official overload/corridor evidence, not a full graph-theoretic centrality model yet.
- The governance/competition argument is currently mechanism-based. It still needs country-level and German regional tender evidence before it can support strong causal claims.
References
- Deutsche Bahn. Integrated Report 2024, punctuality. https://ibir.deutschebahn.com/2024/en/combined-management-report/product-quality-and-digitalization/the-customer-is-at-the-center-of-our-actions/punctuality/
- Deutsche Bahn. Integrated Report 2024, Back on track / S3. https://ibir.deutschebahn.com/2024/en/back-on-track/
- Deutsche Bahn. Integrated Report 2024, revenues. https://ibir.deutschebahn.com/2024/en/combined-management-report/business-development/income-situation/revenues/
- Deutsche Bahn. Integrated Report 2024, consolidated statement of income. https://ibir.deutschebahn.com/2024/en/consolidated-financial-statements/consolidated-statement-of-income/
- Deutsche Bahn Investor Relations. Capital expenditures and public sector grants. https://ir.deutschebahn.com/en/db-group/capital-expenditures/
- Deutsche Bahn. Interim Report 2025, punctuality. https://zbir.deutschebahn.com/2025/en/interim-group-management-report-unaudited/quality-and-security/punctuality/
- Deutsche Bahn. Interim Report 2025, development of the infrastructure. https://zbir.deutschebahn.com/2025/en/interim-group-management-report-unaudited/development-of-business-units/db-infrago-business-unit/development-of-the-infrastructure/
- Federal Ministry of Transport. Agenda to Boost Rail Customer Satisfaction. https://www.bmv.de/SharedDocs/EN/publications/agenda-for-rail-customer-satisfaction.pdf?__blob=publicationFile
- Bundesrechnungshof. Deutsche Bahn: Reform fundamentally and end permanent crisis. https://www.bundesrechnungshof.de/SharedDocs/Kurzmeldungen/EN/kurzmeldungen-berichte/db-dauerkrise/db-dauerkrise.html
- DB InfraGO. InfraGO-Zustandsbericht Netz & Personenbahnhoefe 2025. https://www.dbinfrago.com/web/unternehmen/Strategie-und-mittelfristiges-Zielkonzept/InfraGO-Zustandsbericht-12636112
- DB InfraGO. Neues Hochleistungsnetz fuer die Schiene. https://www.dbinfrago.com/web/schienennetz/fahren_und_bauen/hochleistungsnetz
- Zieger, S., Weik, N., & Niessen, N. The influence of buffer time distributions in delay propagation modelling of railway networks. https://www.sciencedirect.com/science/article/abs/pii/S2210970617301129
- Cats, O., et al. Empirical dynamics of railway delay propagation identified during disruptions. https://www.nature.com/articles/s41598-020-75538-z
- Office of Rail and Road. Options for capacity measures and metrics. https://www.orr.gov.uk/sites/default/files/om/trl_report_options_for_capacity_measures_and_metrics.pdf
- SBB. Punctuality facts and figures. https://reporting.sbb.ch/punctuality
- NS. Annual Report 2024. https://www.nsannualreport.nl/external/asset/download/project/f9822a0a-03ee-0000-1d58-bb5f7bb302a1/name/NS_annualreport_2024.pdf
- JR Central. Integrated Report 2025. https://global.jr-central.co.jp/en/company/ir/annualreport/_pdf/annualreport2025.pdf
- World Bank. China’s High-Speed Rail Development. https://documents1.worldbank.org/curated/en/933411559841476316/pdf/Chinas-High-Speed-Rail-Development.pdf
- Deutsche Bahn KPI annual key figures CSV. https://kpi.deutschebahn.com/fileadmin/ikzv/en/csv/annualKeyFigures.csv
- Eurostat. Rail passenger transport by type of transport. https://ec.europa.eu/eurostat/databrowser/product/view/rail_go_typepas
- Eurostat. Railway transport - train movements. https://ec.europa.eu/eurostat/databrowser/view/rail_tf_trainmv/default/table?lang=en
- Eurostat. Railway lines by type and number of tracks. https://ec.europa.eu/eurostat/databrowser/product/view/rail_if_line_tr
- DB InfraGO. PEK Riedbahn. https://www.dbinfrago.com/resource/blob/12220710/9681d1df23c67f692c0dd5b2a219560c/PEK_Riedbahn-data.pdf
- DB InfraGO. PEK Cologne. https://www.dbinfrago.com/resource/blob/12220698/2173b5356cb2cc5ff05f83106f8149ba/PEK_Koeln_220113-data.pdf
- DB InfraGO. PEK Rhine-Ruhr. https://www.dbinfrago.com/resource/blob/12220706/399eb63c694a1b7be34e3459ae070f7d/pek_Rhein-Ruhr-Achse-data.pdf
- DB InfraGO. PEK Hamburg. https://www.dbinfrago.com/resource/blob/12220690/9290766e269c0b83e026a2519eb23302/pek_hamburg-data.pdf
- Monopolkommission. 9th Sector Report Railways 2023. https://monopolkommission.de/en/?catid=23&id=425%3A9th-sector-report-railways-2023-time-to-go&view=article
- European Commission. Rail Market Monitoring. https://transport.ec.europa.eu/transport-modes/rail/market/rail-market-monitoring-rmms_en
Findings
- Claim 1. DB's punctuality crisis is concentrated most visibly in long-distance rail, while regional aggregate punctuality remains higher. Evidence: DB's KPI and 2024 reporting show DB Long-Distance punctuality at 62.5% in 2024 and 60.1% in 2025, compared with DB Regional at 90.7% in 2024.
- Claim 2. The causes DB itself names are structural: infrastructure condition, intensive construction, high traffic density, staffing shortages, and disruptive events at critical hubs. Evidence: DB's 2025 interim report names poor facility condition, construction activity, high traffic density in Hamburg, Frankfurt, and Cologne, staffing shortages, and cascading disruptive events.
- Claim 3. Delay propagation should be modeled as a network-capacity problem rather than as isolated late trains. Evidence: Railway delay-propagation literature emphasizes buffer time, timetable robustness, route conflicts, and downstream dependencies; DB's own diagnosis points to hubs, construction, and high traffic density.
- Claim 4. The most sensitive parts of the German network are likely the places with the highest delay multiplier, not merely the highest raw traffic. Evidence: Preliminary PEK and DB corridor evidence points to Riedbahn/Frankfurt-Mannheim, Cologne core, Rhine-Ruhr, Hamburg, Hamburg-Hanover, Fulda-Hanau, and Lehrte-Berlin as high-criticality areas.
- Claim 5. Privatization or competition alone is not a sufficient explanation or solution. Evidence: Comparator systems show that both integrated and separated rail models can work or fail; the relevant mechanisms are infrastructure governance, funding stability, access neutrality, capacity allocation, and operational coordination.
Limitations
- The reproducible DB KPI data currently covers 2016-2025; a complete 2000-present reconstruction still requires older DB annual-report extraction.
- The bottleneck ranking is preliminary and uses official overload/corridor evidence rather than a full graph-theoretic centrality model.
- The econometric model is specified but not estimated because a proper annual or corridor-year model panel has not yet been built.
- Cross-country punctuality numbers are not directly comparable because thresholds, cancellation treatment, passenger-weighting, and service scope differ.
- DB, government, and infrastructure-manager sources are essential but self-interested; the claims need further audit-source and independent validation.
References
- https://ibir.deutschebahn.com/2024/en/combined-management-report/product-quality-and-digitalization/the-customer-is-at-the-center-of-our-actions/punctuality/
- https://zbir.deutschebahn.com/2025/en/interim-group-management-report-unaudited/quality-and-security/punctuality/
- https://ibir.deutschebahn.com/2024/en/back-on-track/
- https://ibir.deutschebahn.com/2024/en/combined-management-report/business-development/income-situation/revenues/
- https://ibir.deutschebahn.com/2024/en/consolidated-financial-statements/consolidated-statement-of-income/
- https://ir.deutschebahn.com/en/db-group/capital-expenditures/
- https://zbir.deutschebahn.com/2025/en/interim-group-management-report-unaudited/development-of-business-units/db-infrago-business-unit/development-of-the-infrastructure/
- https://www.bmv.de/SharedDocs/EN/publications/agenda-for-rail-customer-satisfaction.pdf?__blob=publicationFile
- https://www.bundesrechnungshof.de/SharedDocs/Kurzmeldungen/EN/kurzmeldungen-berichte/db-dauerkrise/db-dauerkrise.html
- https://www.dbinfrago.com/web/unternehmen/Strategie-und-mittelfristiges-Zielkonzept/InfraGO-Zustandsbericht-12636112
- https://www.dbinfrago.com/web/schienennetz/fahren_und_bauen/hochleistungsnetz
- https://www.sciencedirect.com/science/article/abs/pii/S2210970617301129
- https://www.nature.com/articles/s41598-020-75538-z
- https://www.orr.gov.uk/sites/default/files/om/trl_report_options_for_capacity_measures_and_metrics.pdf
- https://reporting.sbb.ch/punctuality
- https://www.nsannualreport.nl/external/asset/download/project/f9822a0a-03ee-0000-1d58-bb5f7bb302a1/name/NS_annualreport_2024.pdf
- https://global.jr-central.co.jp/en/company/ir/annualreport/_pdf/annualreport2025.pdf
- https://documents1.worldbank.org/curated/en/933411559841476316/pdf/Chinas-High-Speed-Rail-Development.pdf
Comments
Comments are powered by GitHub Discussions. You can read without signing in; posting requires a GitHub account.