Germany’s Heat Problem Was Not A Surprise
Every time Germany gets hit by a serious heatwave, the country seems to rediscover the same basic facts. Apartments overheat. Hospitals and care homes struggle. Rail, roads, schools, offices, and outdoor work all become less reliable. The public debate then falls into a familiar argument: maybe Germany was never built for this because Germany used to have mild summers.
There is truth in that. German summers were milder in important statistical senses. The hottest daytime temperatures were lower. Tropical nights were less common. The upper tail of the temperature distribution has clearly shifted. Climate change is not a branding exercise here; it shows up in the measurements.
But the convenient version of the story is also too forgiving. Germany did not go from “no heat problem” to “heat problem” overnight. The official German and European language around heat now treats it as a recurring public-health risk. The European Environment Agency says heat is the deadliest weather- and climate-related extreme in Europe. Germany’s health ministry has treated heat protection as a standing health issue, not a one-off weather alert. The hospital and care sectors are increasingly explicit that warnings and brochures are not enough when buildings themselves cannot stay safe.
That is the tension this article is about. If heat was impossible to predict, then poor preparation would be understandable. If it was a foreseeable risk that became steadily more serious, then the policy failure is harder to excuse.
The short version is this: the DWD station data says modern German heat is worse, especially for daytime extremes and post-2000 hot-day-plus-hot-night heatwaves. It also says dangerous heat was not absent before. The infrastructure conclusion is not “Germany should have known today’s exact heatwave.” It is “Germany should have known heat resilience was becoming essential.”
The Debate Has Already Moved
German institutions are no longer debating whether heat deserves public-health attention. The Federal Health Ministry has called heat protection a “Dauerproblem.” The European Environment Agency says heat causes Europe’s largest death toll among weather- and climate-related extremes. Germany’s 2024 adaptation strategy turns climate adaptation into measurable goals across health, care, infrastructure, urban development, and civil protection. RKI estimates thousands of heat-related deaths in recent German summers. European institutions say the same thing at continental scale: Europe is warming quickly, heat-stress days are increasing, and heat-health action plans are now a normal part of climate adaptation.
The political fight is therefore not really about whether heat exists. It is about what kind of response counts as serious. German heat policy often emphasizes warning systems, public information, municipal plans, shading, greening, and protection of vulnerable groups. Those things matter. But hospitals, care homes, top-floor apartments, schools, and poorly ventilated buildings raise a harder question: what happens when passive measures are not enough?
The hospital sector has started saying this out loud. The Deutsche Krankenhausgesellschaft has called for major investment in climate-resilient hospitals. Care-sector guidance discusses indoor room temperatures, not just outdoor forecasts. Green politicians have put the missing-equipment problem bluntly: “Es fehlt an Klimaanlagen.” A 2025 federal answer on hospital heat protection, meanwhile, leaned on the divided responsibility of facility owners and German states. That may be administratively true. It is not reassuring.
A heat policy that cannot keep vulnerable people indoors at survivable temperatures is not yet a heat policy. It is a warning system with paperwork.
What I Measured
The empirical question is narrower than the political argument: how different are German summers now from the relevant past?
For this version of the analysis, I use direct DWD daily climate station observations, not a gridded interpolation. That matters because the “where did this happen?” question is central to the heat debate. Stations are not perfect either. They can move, instrumentation can change, and local siting matters. But they are concrete measurements at known locations, and they let us test whether the old “milder summers” claim survives contact with daily observations.
The data and definitions are:
- Primary source: DWD daily climate station observations.
- Panel: 193 long-running stations with at least 90% coverage across the comparison periods.
- Variables: daily maximum temperature (
Tmax), daily minimum temperature (Tmin), daily mean temperature (Tmean). - Periods: 1951-1960 through 2011-2020, plus 2021-2025 as a five-year recent period.
- 2026: included only as partial current context through June 29, 2026.
- Main heatwave definition: same station, at least 3 consecutive days with
Tmax >= 30 CandTmin >= 20 C. - Intensity: cumulative excess heat above the selected Tmax and Tmin thresholds, measured in C-days.
The distinction between daily maximum and daily minimum temperature is important. Daytime heat makes outside work, transport, surfaces, and electricity demand more dangerous. Nighttime heat decides whether buildings and bodies get to recover. A country can tolerate some hot afternoons if nights cool down. It has a different problem when hot days are followed by tropical nights.
Daytime Extremes Really Did Move Up
The clearest result is daytime maximum temperature. The record and P95 anomaly series for summer months move from clearly negative in earlier decades to clearly positive after 2000. This is not just one freak record. The high end of the daily Tmax distribution shifted upward.
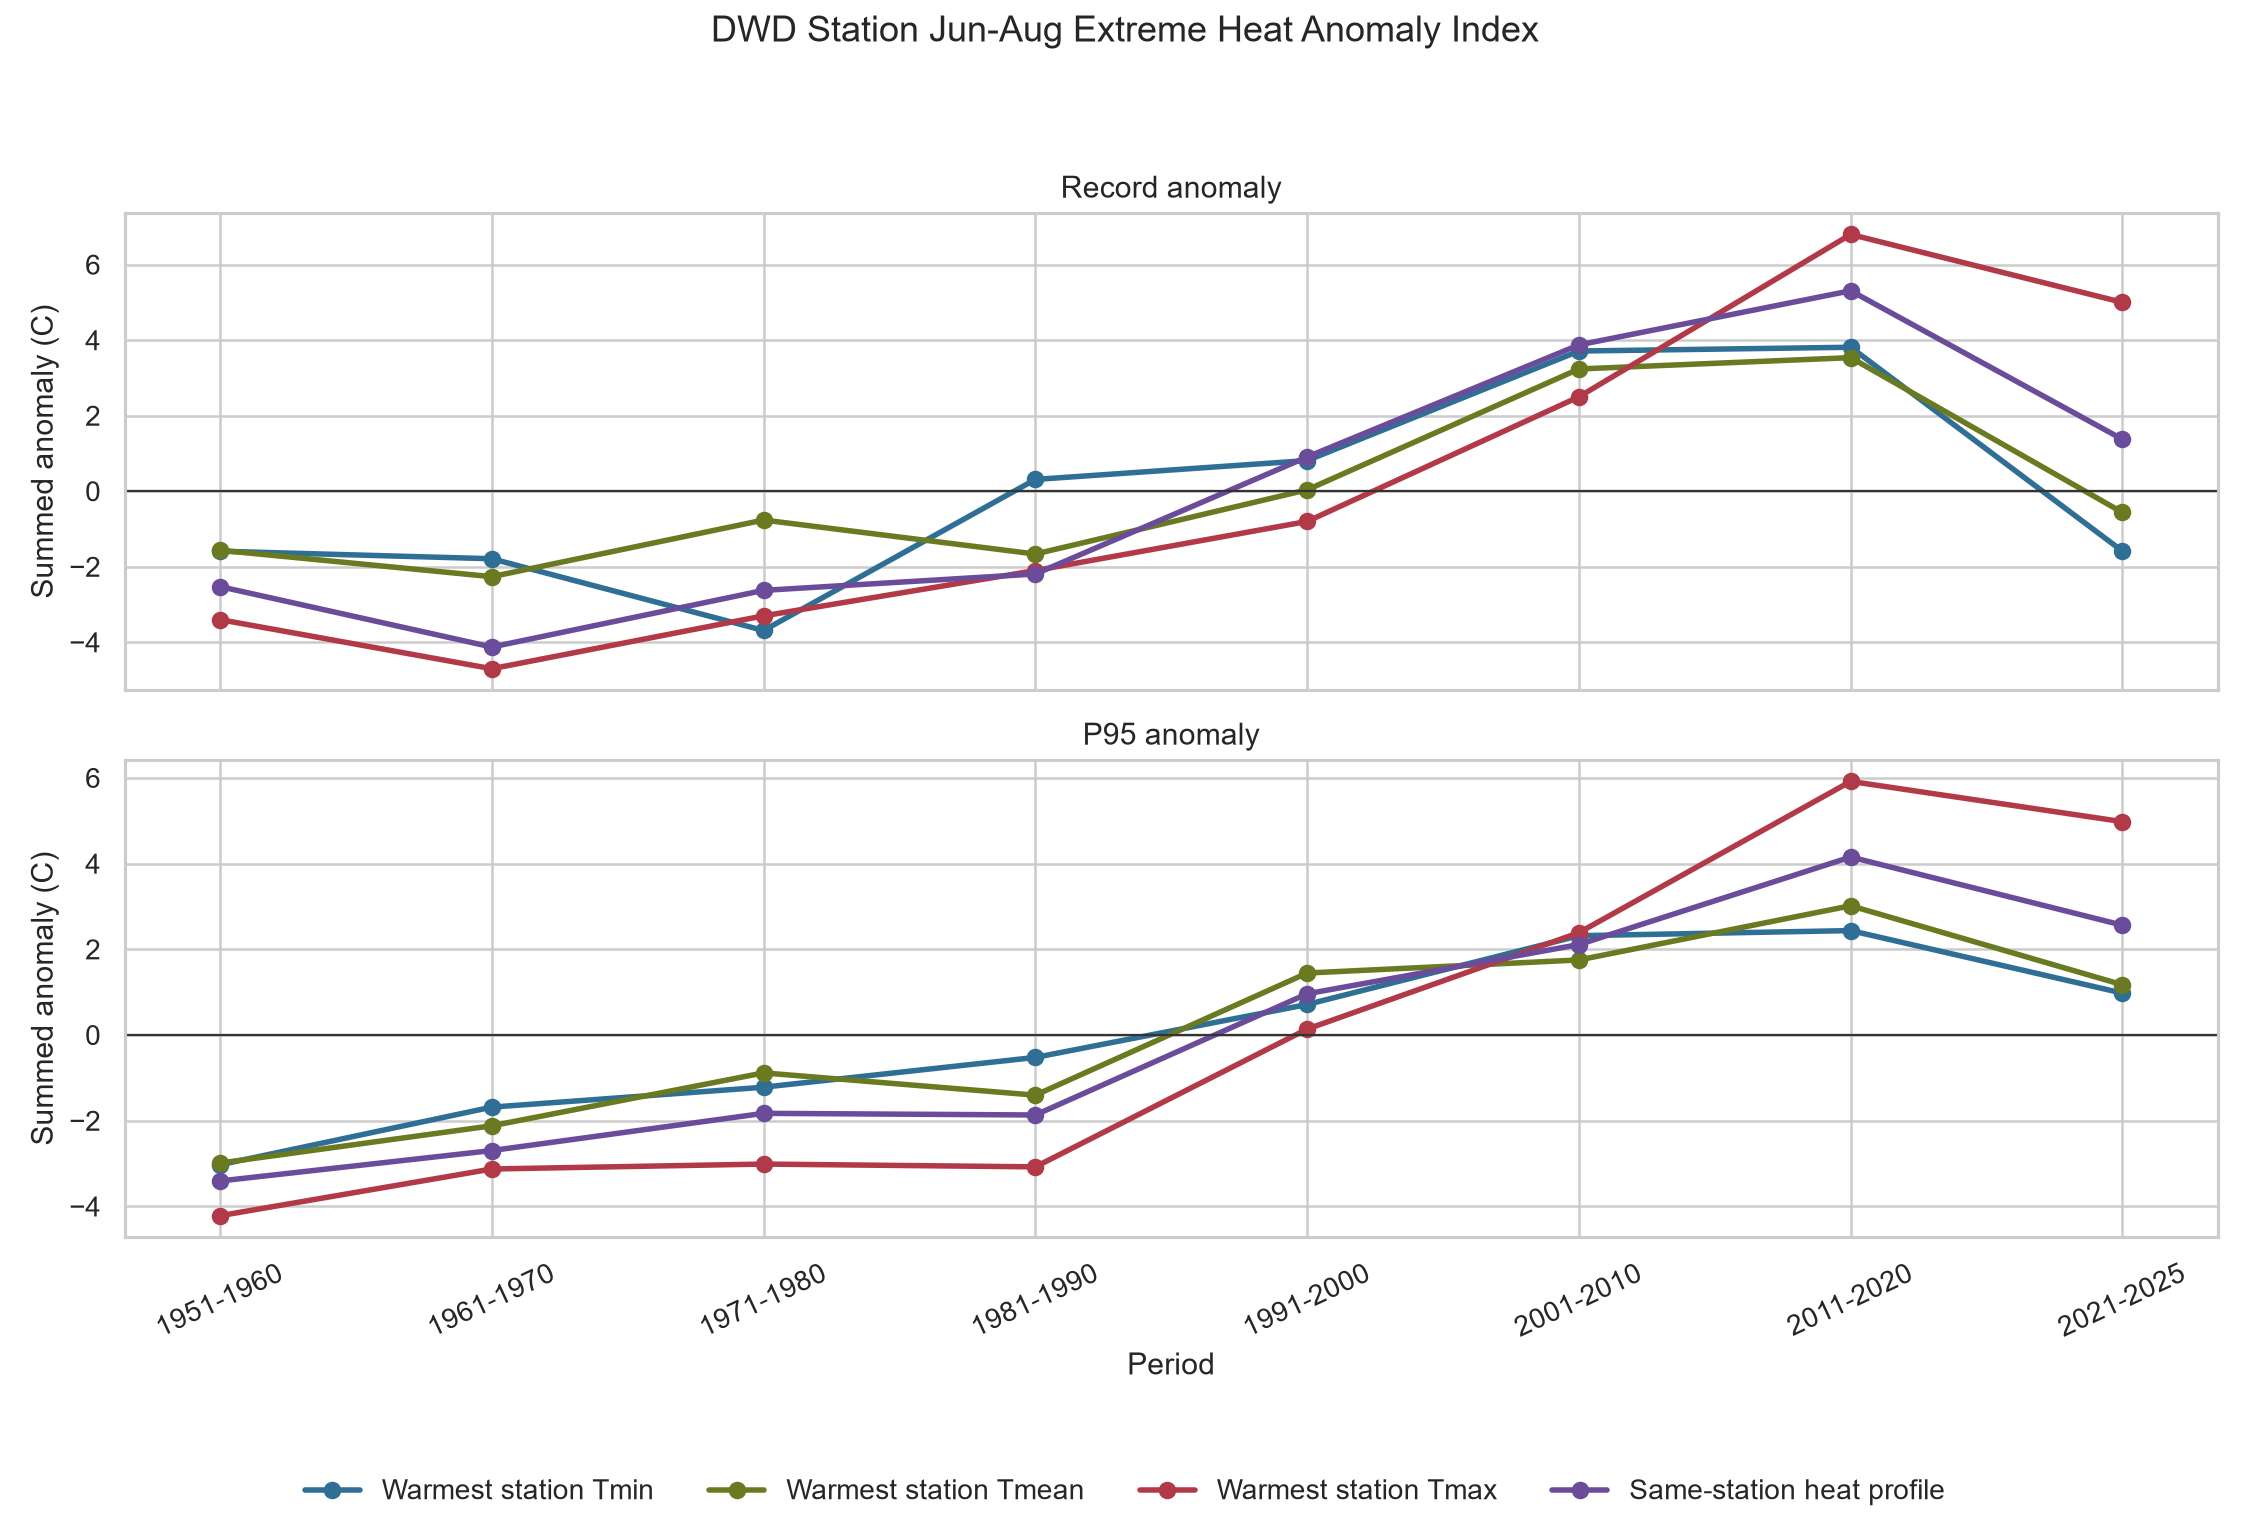
| Period | Summer Tmax record anomaly | Summer Tmax P95 anomaly |
|---|---|---|
| 1951-1960 | -3.40 C | -4.22 C |
| 1961-1970 | -4.70 C | -3.13 C |
| 1971-1980 | -3.30 C | -3.01 C |
| 1981-1990 | -2.10 C | -3.08 C |
| 1991-2000 | -0.80 C | +0.14 C |
| 2001-2010 | +2.50 C | +2.39 C |
| 2011-2020 | +6.80 C | +5.92 C |
| 2021-2025 | +5.00 C | +4.98 C |
The threshold counts are even more intuitive. In the fixed station panel, the annualized number of days with at least one station at Tmax >= 30 C rises from 21.8 in 1951-1960 to 44.8 in 2011-2020 and 49.2 in 2021-2025. For Tmax >= 35 C, the same metric rises from around two days per year in the early decades to 10.4 in 2011-2020 and 8.8 in 2021-2025.
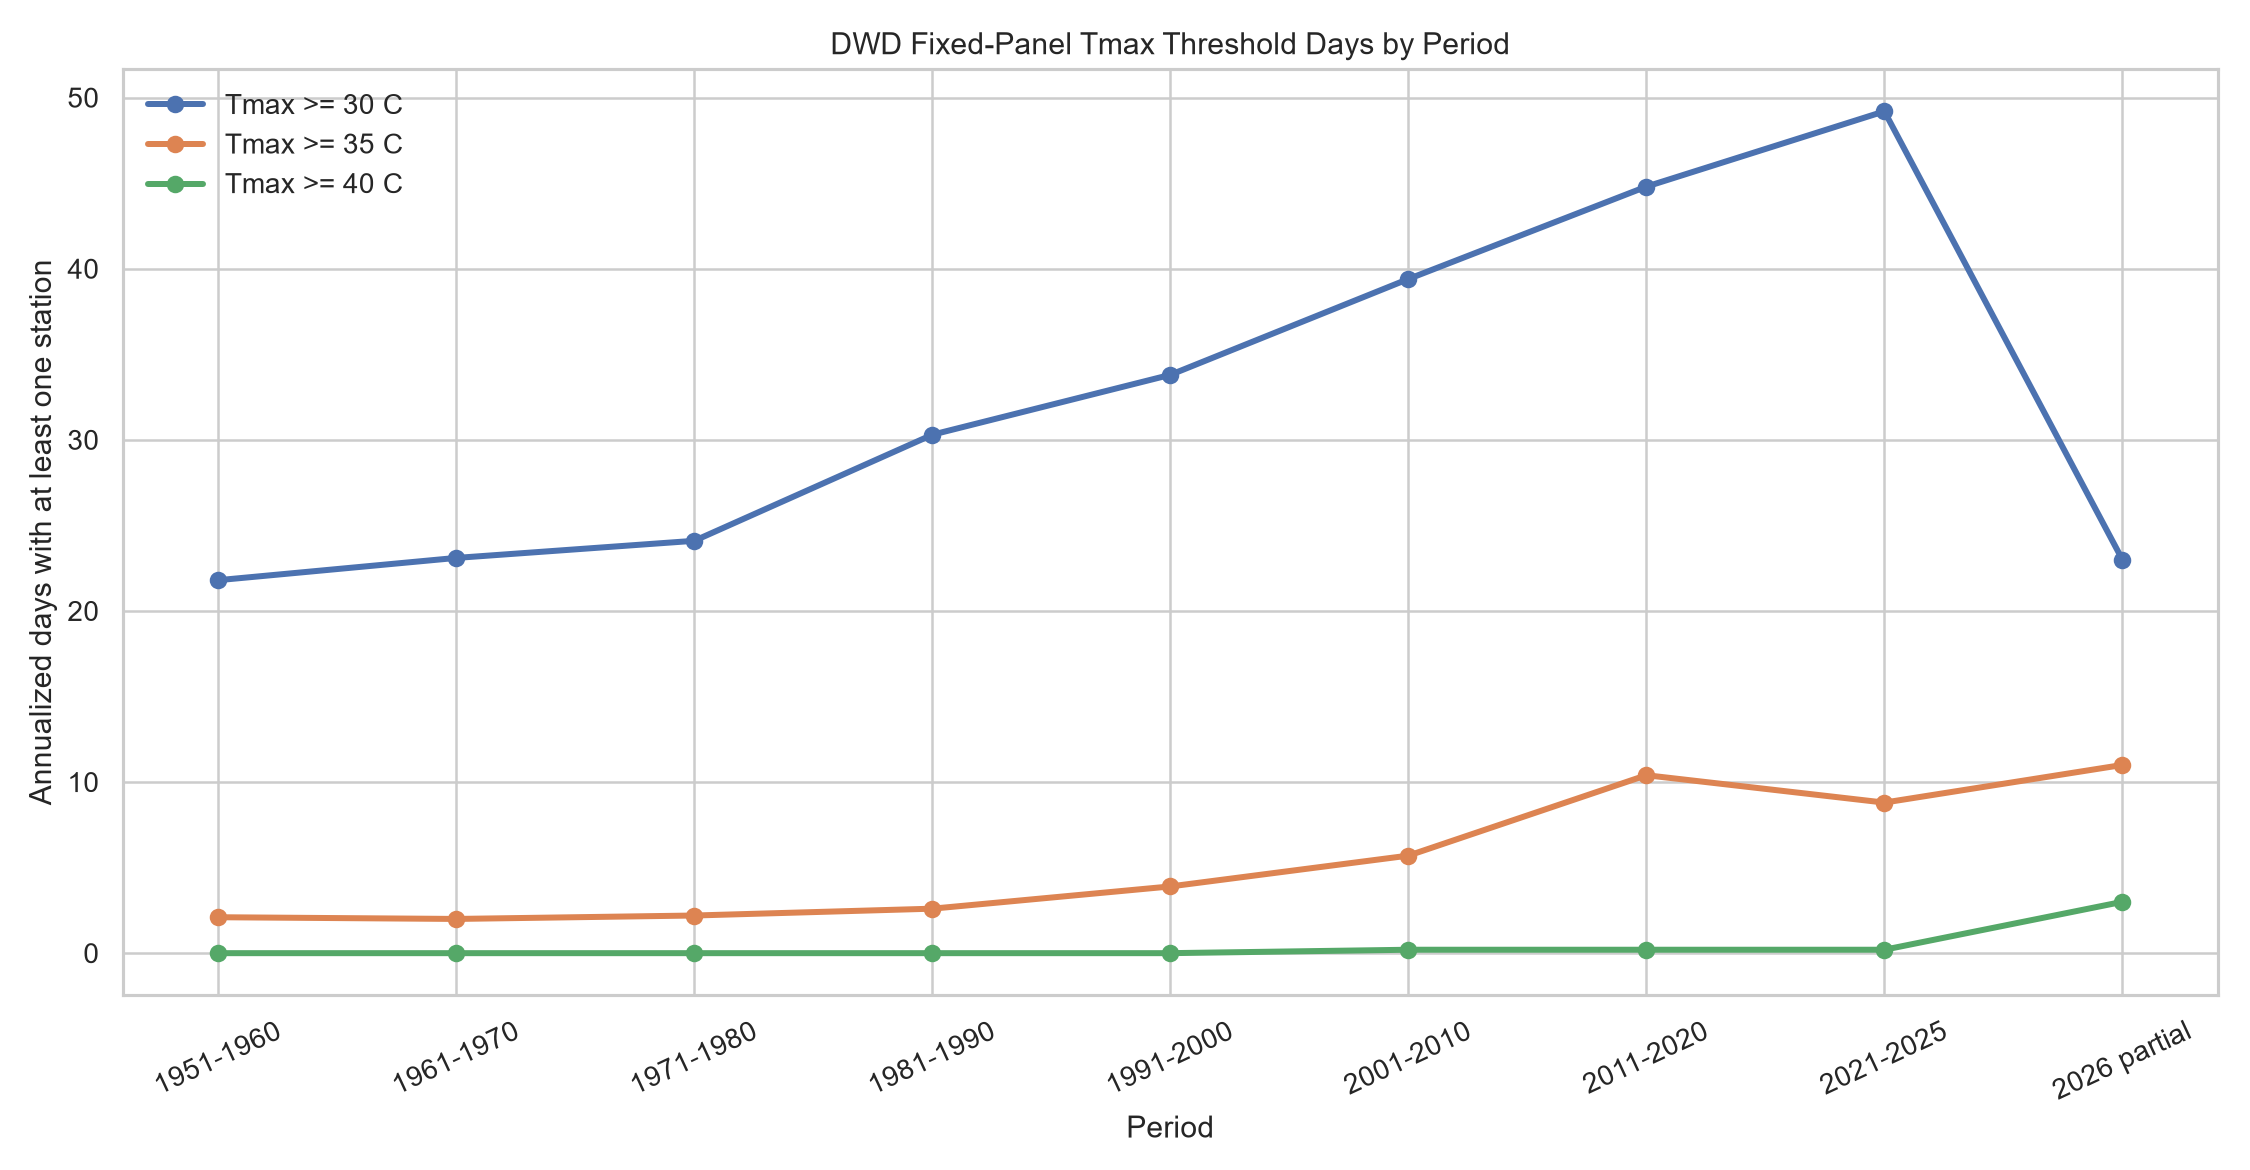
The 40 C threshold is rarer, but politically important because it is the kind of number that makes people ask whether Germany has become a different country. In this fixed station panel, years with at least one station day at or above 40 C are 2003, 2015, 2019, and 2022. That does not mean there was no dangerous heat earlier. It means that the most extreme fixed-panel station days are concentrated after 2000.
The Night Is The Infrastructure Test
Hot nights are where the mild-summer argument becomes much less abstract. If the day is hot but the night cools, an old apartment might be uncomfortable but survivable. If the day is hot and the night stays hot, people sleep badly, buildings retain heat, hospital rooms do not reset, and vulnerable people accumulate physiological stress.
On this metric, the DWD signal is real but less clean than daytime maximum temperature. Annualized days with at least one fixed-panel station at Tmin >= 20 C rise from 4.8 in 1951-1960 to 15.0 in 2001-2010 and 2011-2020, then 14.8 in 2021-2025. Severe hot nights at Tmin >= 25 C remain rare in completed periods, so they should not carry the main historical claim.
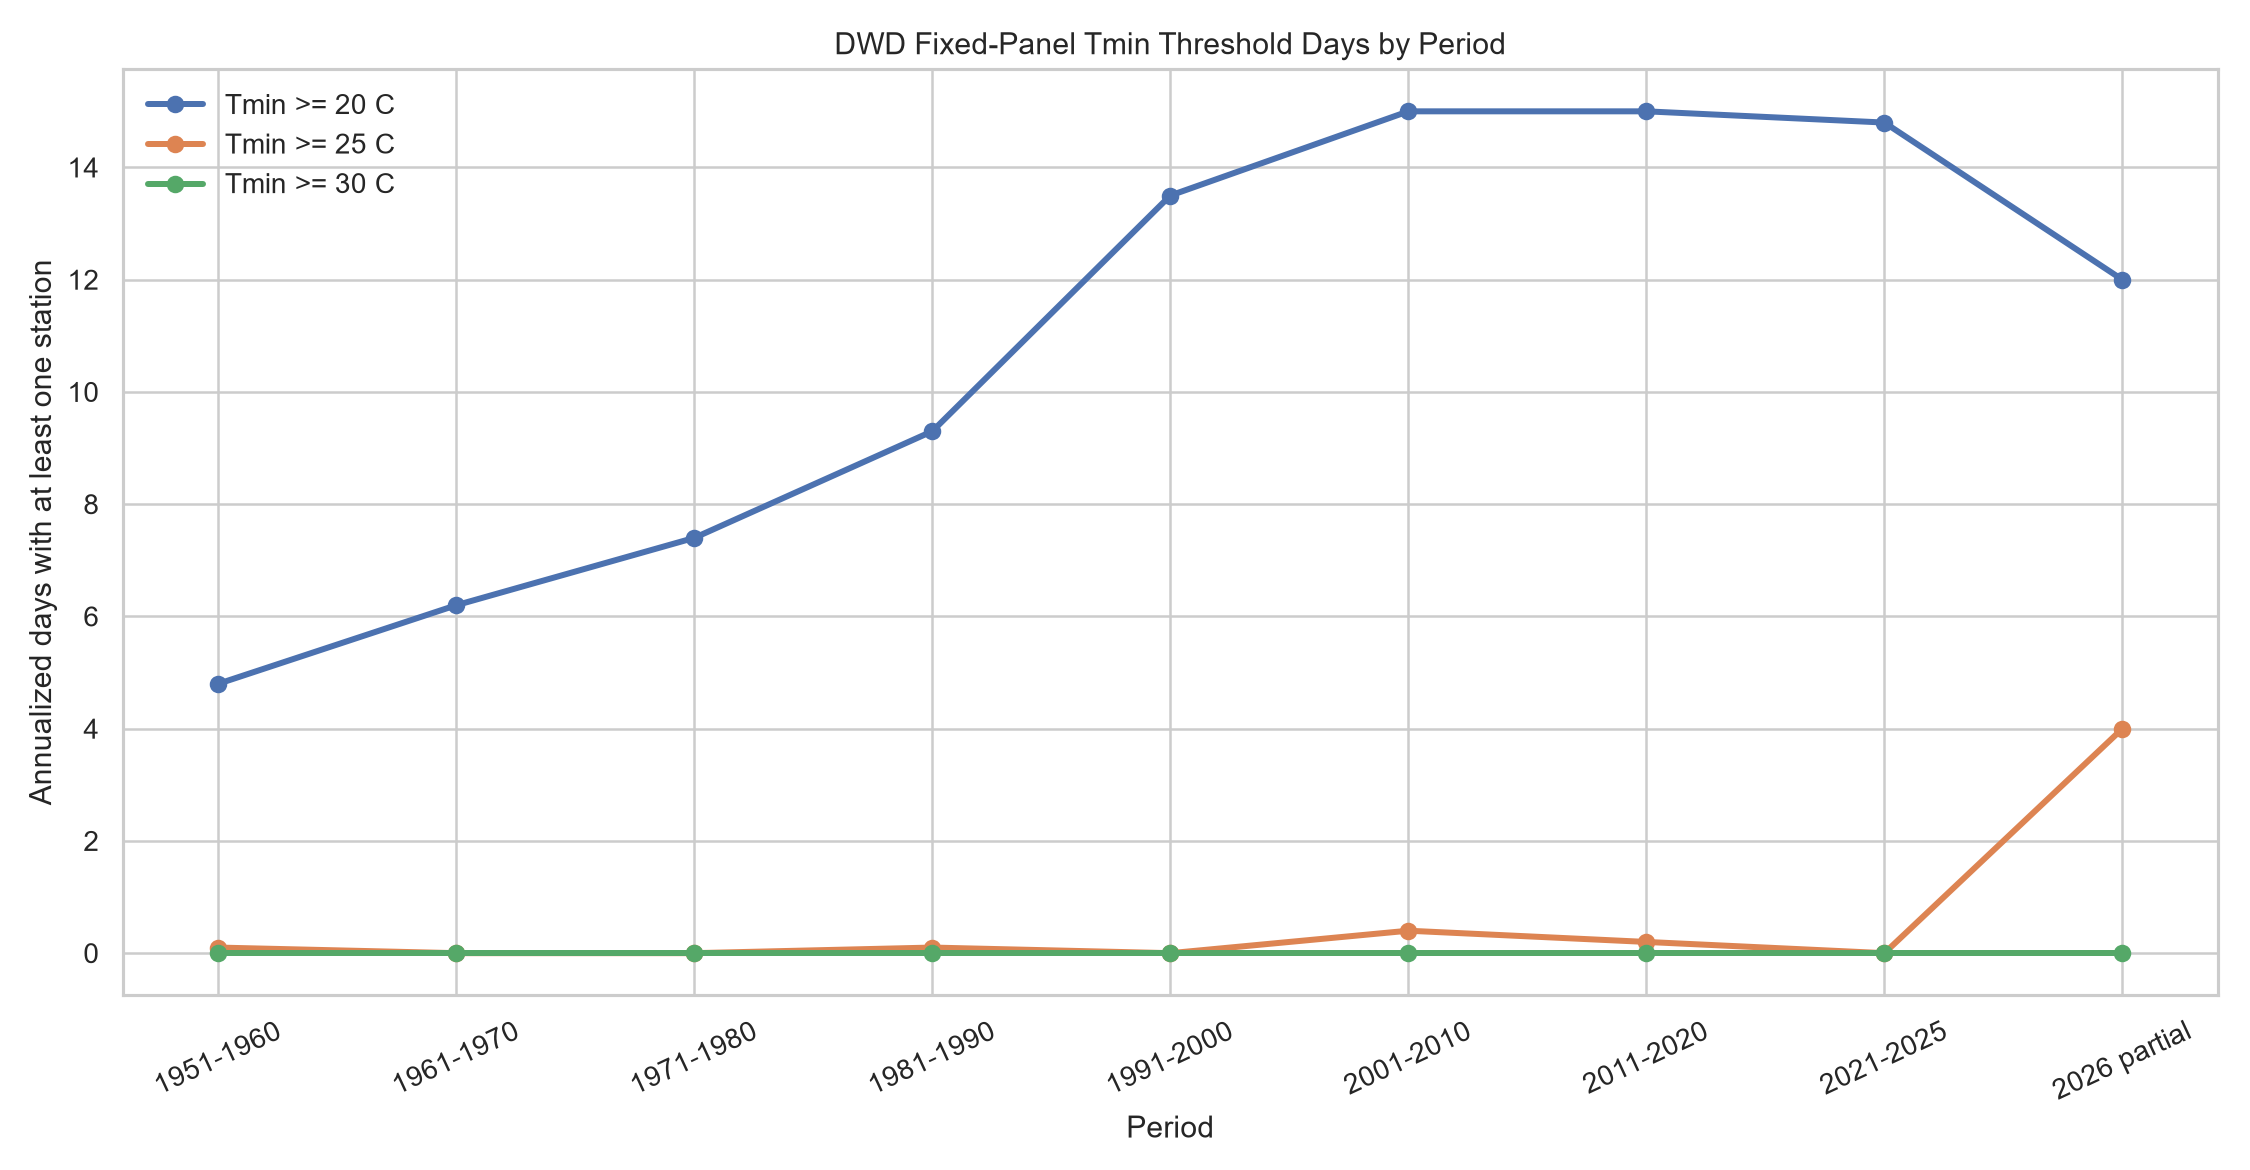
This is where official heat guidance and the data meet. Heat-warning practice and care-setting guidance both care about nighttime recovery and indoor temperatures. Care guidance does not ask whether patients are philosophically entitled to cold air; it asks whether rooms stay within safe temperature ranges. Once nights fail to cool buildings, heat is not just weather. It is building performance.
Heatwaves: Not New, But Worse After 2000
A single hot day is not the same thing as a heatwave. For the main heatwave metric, I require the same station to record Tmax >= 30 C and Tmin >= 20 C for at least three consecutive calendar days. That is a deliberately strict definition: a hot day plus a hot night, sustained locally.
The result is not “Germany never had heatwaves before.” It did. The 1951-1960 period has 26 same-station events under this definition. That matters because it weakens the excuse that dangerous heat was unimaginable. But the post-2000 decades stand out.
| Period | Heatwaves | Annualized frequency | Longest streak | Max intensity |
|---|---|---|---|---|
| 1951-1960 | 26 | 2.6 | 5 days | 35.1 C-days |
| 1961-1970 | 0 | 0.0 | 0 days | 0.0 C-days |
| 1971-1980 | 13 | 1.3 | 5 days | 19.6 C-days |
| 1981-1990 | 5 | 0.5 | 3 days | 23.3 C-days |
| 1991-2000 | 11 | 1.1 | 7 days | 41.6 C-days |
| 2001-2010 | 47 | 4.7 | 12 days | 121.7 C-days |
| 2011-2020 | 64 | 6.4 | 6 days | 40.0 C-days |
| 2021-2025 | 11 | 2.2 | 4 days | 22.6 C-days |
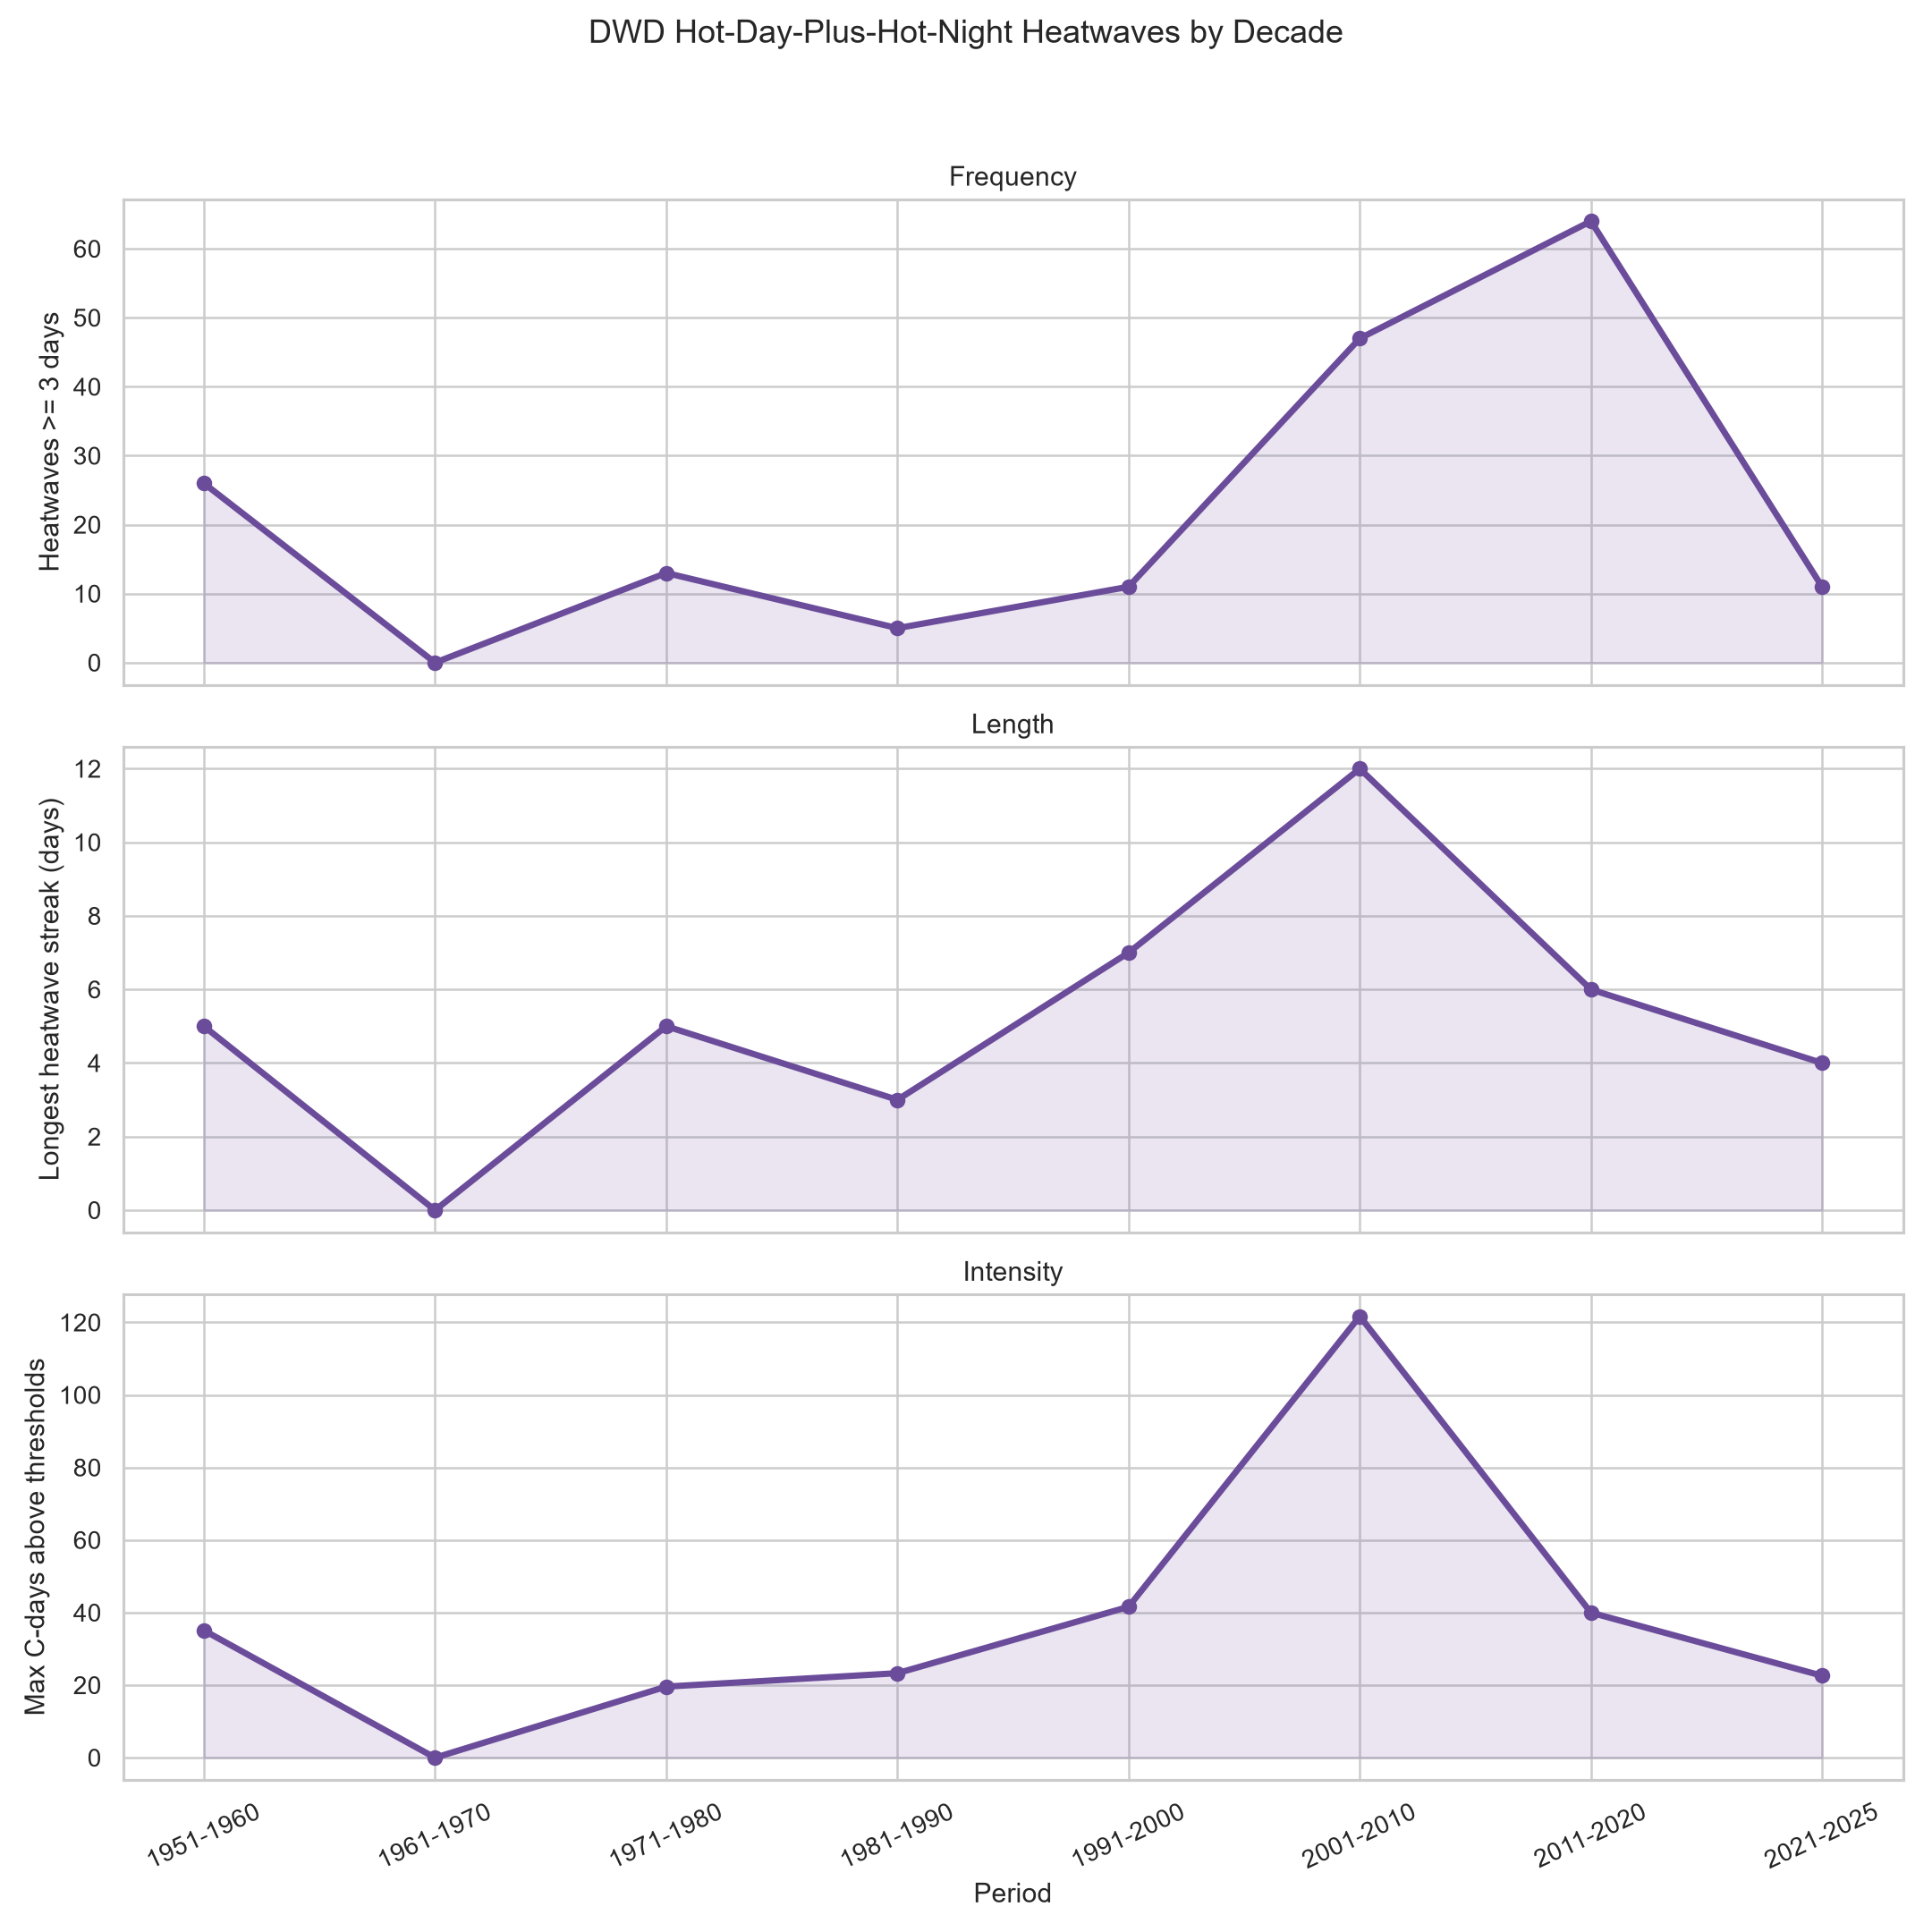
The frequency peak is 2011-2020. The length and single-event intensity peak is 2001-2010, driven by the 2003 Freiburg event, which lasted 12 days and accumulated 121.7 C-days above the selected thresholds. That is an important political date. If 2003 did not end the idea that heat resilience was optional, what exactly would have?
Timing Matters Too
Monthly timing changes the lived experience of heat. A severe July is different from a severe June. A building that has already accumulated heat by August is different from one facing its first hot week. The primary heatwave definition concentrates in summer, as expected, but recent periods show heatwave starts outside the old July-only mental model.
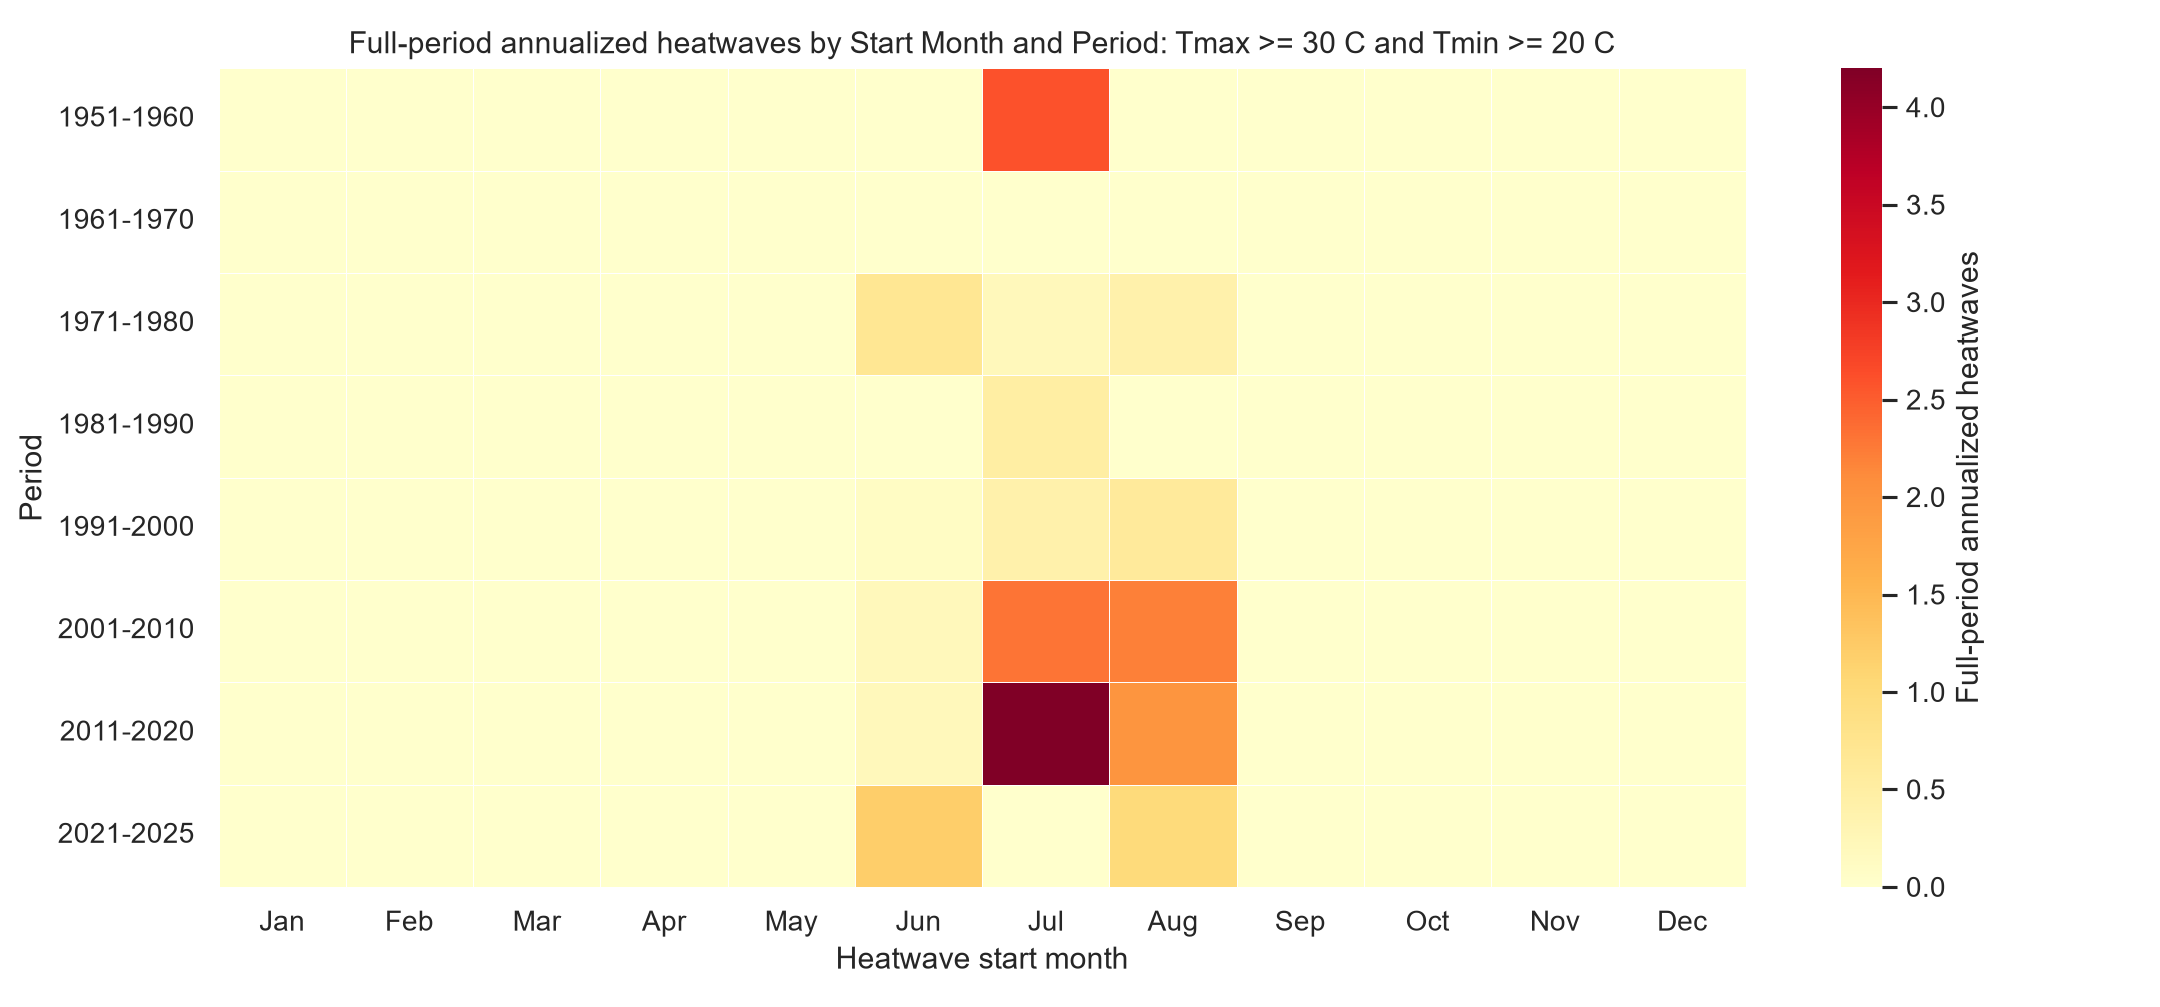
The start-month metric is not perfect. It assigns a heatwave to the month in which it begins, so an event crossing a month boundary is not split day by day. But for the narrative question, it is still useful: it tells us when heatwave episodes arrive.
The Composite Burden Is A Summary, Not A Substitute
To compress frequency, length, and intensity into one index, I built a composite heatwave burden metric. Each component is normalized within the definition, then combined geometrically and scaled around 100. This is helpful for orientation, but it should not replace the components. A decade can score high because it has many events, because it has a very long event, or because one event is extremely intense.
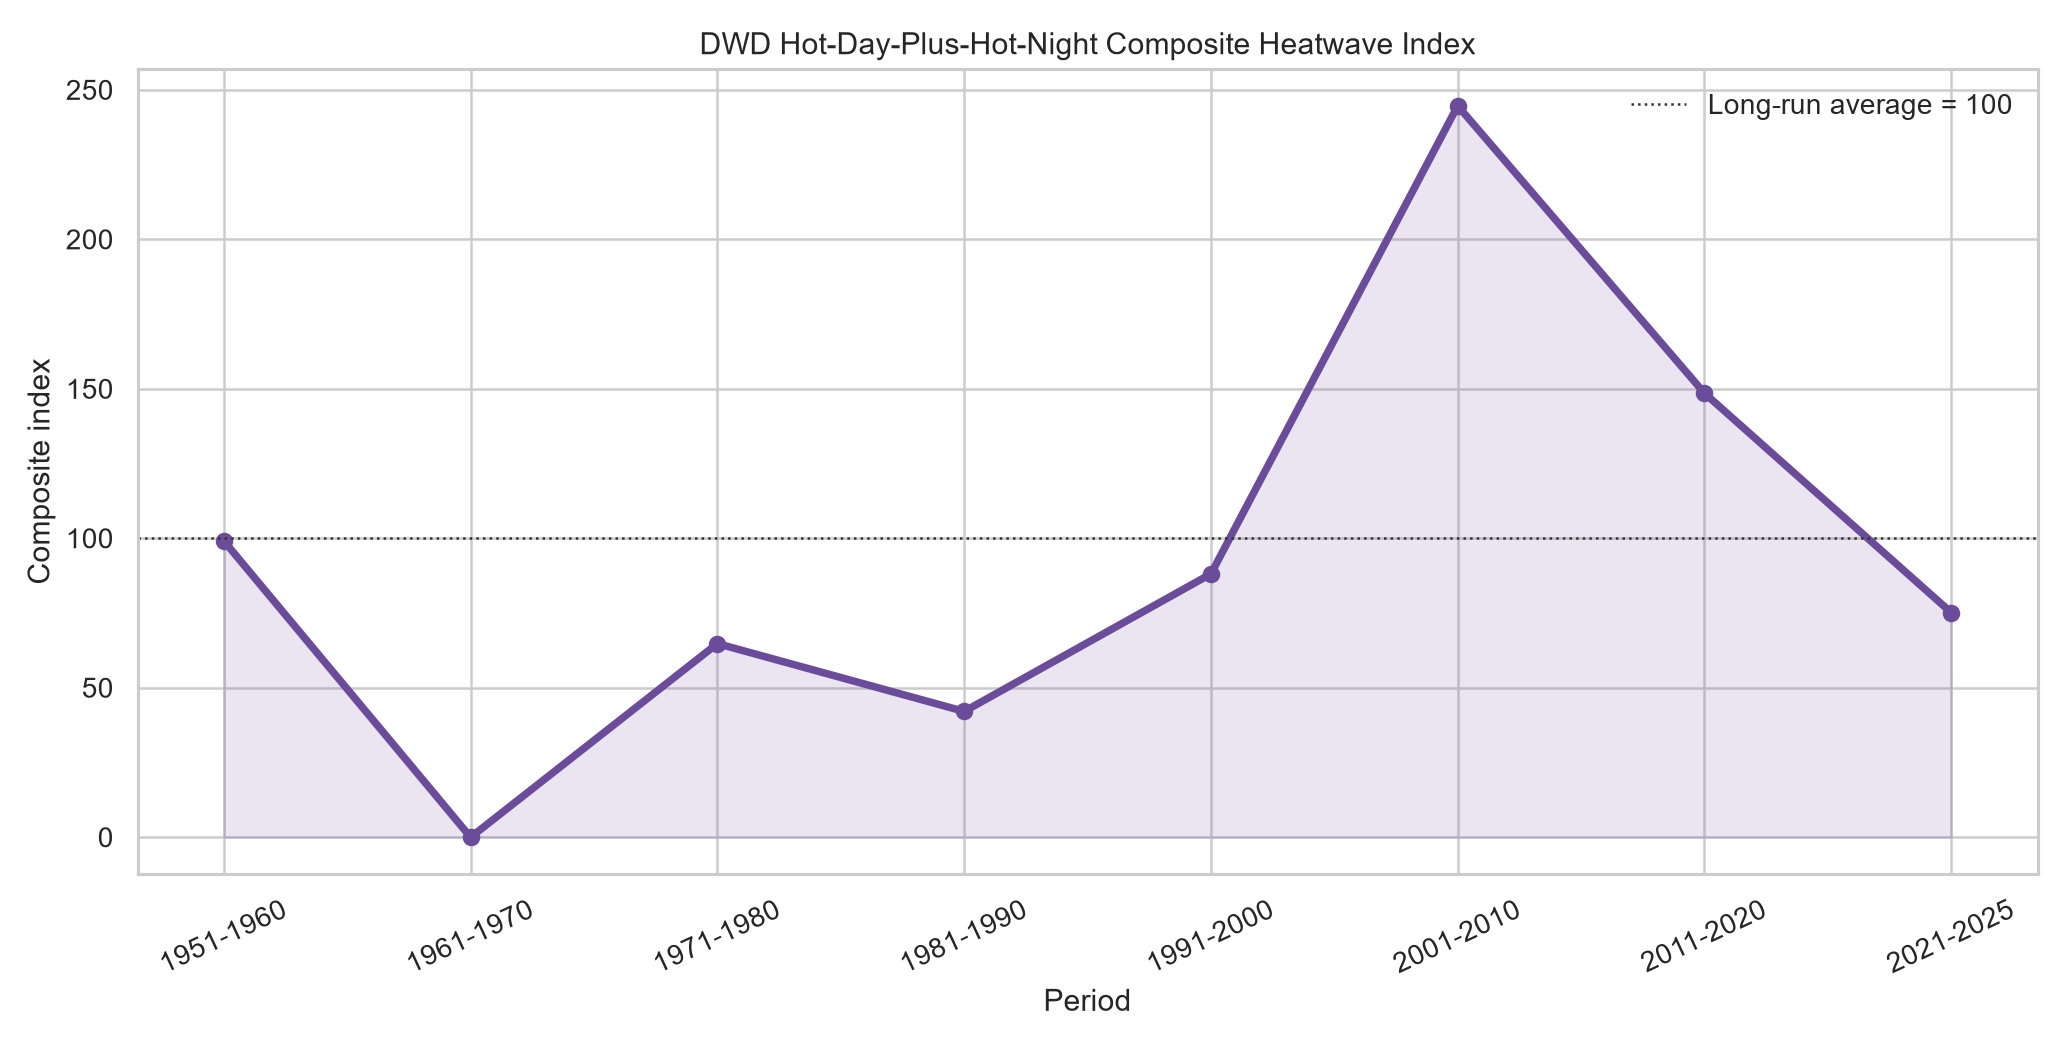
For the main definition, 2001-2010 scores highest because 2003 was such a large event. If the question is repeated annual burden, 2011-2020 looks more important. This is why the honest answer is not one chart. It is a bundle of evidence: hotter daytime extremes, more tropical-night days after 1990, more strict heatwaves after 2000, and one historically large early-2000s event that should have been treated as a warning.
So Were German Summers Milder?
Yes, but not in the way the comforting version of the story implies.
They were milder in the upper tail. The hottest daytime temperatures and high-percentile summer Tmax values were lower. Hot nights at Tmin >= 20 C were less common. The 40 C fixed-panel station days appear after 2000. If someone says the average German built environment was designed around a cooler climate, the data supports that.
But Germany did not have zero heat risk. The country had hot days. It had tropical nights. It had same-station hot-day-plus-hot-night heatwaves under the strict definition. The 2003 heatwave was not last summer. It was more than two decades ago. The post-2000 trend gave policymakers, hospital administrators, city planners, landlords, and infrastructure operators a long runway.
This is the part of the debate that often gets muddled. Climate change can explain why the problem is worse. It cannot explain why adaptation remained so timid. If anything, the climate-change argument makes the adaptation failure more serious. A forecasted risk is not an excuse. It is a notice.
The Cooling Question
Air conditioning is not a magic wand, and Germany should not copy the dumbest version of American cooling policy: leaky buildings, weak efficiency standards, huge peak loads, and refrigerants treated as an afterthought. But the opposite answer, pretending active cooling is a decadent lifestyle preference, is also unserious.
The better frame is planned cooling. Hospitals and care homes first. Then schools, top-floor housing, public cooling spaces, critical workplaces, and vulnerable households. Passive design, shading, ventilation, insulation, reflective surfaces, urban trees, and district cooling should all come before or alongside active cooling. But where those measures fail, efficient electrified cooling is public-health infrastructure.
Technology has made that position easier to defend. Modern heat pumps can provide heating and cooling. EU F-gas rules are pushing refrigerants away from high-global-warming-potential chemicals. The European Commission now regulates a phase-down and eventual phase-out path for HFCs. The IEA has argued for high-efficiency cooling policy precisely because unmanaged cooling demand is a grid problem, while efficient cooling can sharply reduce energy and peak-load impacts. A cleaner electricity system also changes the carbon arithmetic over time.
None of this means every German apartment needed central AC in 1995. It means the serious policy answer was never “suffer and open a window.” It was to integrate cooling into building renovation, heat-pump deployment, hospital modernization, care-home standards, urban planning, and grid planning.
The Judgment
The charitable argument for Germany is that it built for the climate it had. That explains some of the starting point. It does not explain the slow response after the warning signs became obvious.
By the 2000s, Germany had already experienced heat severe enough to expose the weakness of the old assumptions. By the 2010s, the upper tail was moving further. By the 2020s, federal ministries, European agencies, public-health bodies, hospitals, and care organizations were all speaking the language of recurrent heat risk. The country was not blindsided by a meteorological impossibility. It was overtaken by a problem it had been describing for years.
That is why the current debate should not be reduced to “is this heatwave unprecedented?” The better question is: what level of heat should a rich, aging, industrial country have been prepared to manage?
The answer from the data is uncomfortable. German summers really are hotter now, especially at the extreme daytime end. Hot nights and strict hot-day-plus-hot-night heatwaves are more visible in the modern record. But the historical record also shows enough dangerous heat to make total institutional surprise implausible. Germany can say the problem got worse. It cannot honestly say the problem came from nowhere.
Heat adaptation is not a culture-war luxury. It is what public health, buildings, and infrastructure have to become when the climate changes. The failure is not that Germany lacked perfect foresight. The failure is that it had enough foresight to act, and still treated too much of cooling as optional.
Reproducibility
Primary scripts:
analysis/scripts/download_dwd_station_raw.pyanalysis/scripts/process_dwd_station_raw.pyanalysis/scripts/make_dwd_station_figures.pyanalysis/scripts/make_dwd_threshold_figures.pyanalysis/scripts/make_dwd_heatwave_metrics.py
Primary generated tables:
analysis/tables/dwd_threshold_counts_by_period.csvanalysis/tables/dwd_heatwave_definitions.csvanalysis/tables/dwd_heatwave_period_summary.csvanalysis/tables/dwd_heatwave_month_period_summary.csvanalysis/tables/dwd_station_decade_extreme_anomaly_indices.csv
The full working archive remains in the writing-pipeline draft folder. The published article uses DWD station observations as the primary evidence and keeps HYRAS-DE as a secondary gridded comparison asset.
Findings
- Claim 1. German summer daytime extremes shifted upward after 1990, with the clearest signal in Tmax. Evidence: Summer Tmax record anomalies move from -3.40 C in 1951-1960 and -4.70 C in 1961-1970 to +6.80 C in 2011-2020 and +5.00 C in 2021-2025; summer Tmax P95 anomalies show the same post-2000 shift.
- Claim 2. Hot nights became more common after 1990, but the extreme hot-night thresholds remain sparse in completed periods. Evidence: Annualized days with at least one fixed-panel station at Tmin >= 20 C rise from 4.8 in 1951-1960 to 15.0 in 2001-2010 and 2011-2020, while Tmin >= 25 C remains rare in completed periods.
- Claim 3. Hot-day-plus-hot-night heatwaves existed before 2000, but post-2000 heatwave burden is higher on frequency, length, and intensity metrics. Evidence: The primary same-station definition records 26 events in 1951-1960, 47 in 2001-2010, and 64 in 2011-2020; the 2003 Freiburg event lasted 12 days and reached 121.7 C-days of cumulative excess heat.
- Claim 4. The infrastructure argument should be based on foreseeable and increasing heat risk, not only on whether every recent heatwave is unprecedented. Evidence: The station record contains historical heat risk before 2000 and stronger modern exposure after 2000; German and European institutions now frame heat as a recurring public-health and adaptation problem.
Limitations
- The primary DWD analysis uses a fixed panel of 193 station observations, not a full spatial grid.
- Station observations are point measurements and can be affected by station moves, instrumentation, local siting, and panel selection.
- Heatwave counts are same-station events across the fixed panel, not unique Germany-wide national heatwave declarations.
- 2021-2025 is a five-year recent period, not a decade.
- 2026 observations are partial through 2026-06-29 and are used only as current context.
- Monthly heatwave frequency assigns events by start month; it does not yet split station-days or excess heat across month boundaries.
References
- DWD Climate Data Center, Daily climate station observations: https://opendata.dwd.de/climate_environment/CDC/observations_germany/climate/daily/kl/
- DWD Climate Data Center, HYRAS-DE daily gridded temperature data: https://opendata.dwd.de/climate_environment/CDC/grids_germany/daily/hyras_de/
- Bundesministerium fuer Gesundheit, Gesundheitsrisiko Hitze: https://www.bundesgesundheitsministerium.de/themen/praevention/hitze
- Bundesministerium fuer Gesundheit, Lauterbach legt Hitzeschutzplaene vor: https://www.bundesgesundheitsministerium.de/presse/pressemitteilungen/lauterbach-legt-hitzeschutzplaene-vor-pm-24-05-24
- Bundesministerium fuer Umwelt, Klimaschutz, Naturschutz und nukleare Sicherheit, Deutsche Anpassungsstrategie an den Klimawandel: https://www.bundesumweltministerium.de/themen/klimaanpassung/die-deutsche-anpassungsstrategie-an-den-klimawandel
- Robert Koch-Institut, Hitzebedingte Mortalitaet in Deutschland 2023 und 2024: https://www.rki.de/DE/Aktuelles/Publikationen/Epidemiologisches-Bulletin/2025/19_25.html
- European Environment Agency, The impacts of heat on health: https://www.eea.europa.eu/en/analysis/publications/the-impacts-of-heat-on-health
- European Climate and Health Observatory, Heat: https://climate-adapt.eea.europa.eu/en/observatory/topics/health-impacts/heat-and-health
- Copernicus Climate Change Service, European State of the Climate 2025 charts: https://climate.copernicus.eu/ten-charts-discover-european-state-climate-2025-report
- Deutsche Krankenhausgesellschaft, Hitzeschutz und klimaresiliente Klinikmodernisierung: https://www.dkgev.de/dkg/presse/details/sondervermoegen-jetzt-fuer-hitzeschutz-und-klimaresiliente-klinikmodernisierung-einsetzen/
- Bundestagsfraktion Buendnis 90/Die Gruenen, Menschen vor extremer Hitze schuetzen: https://www.gruene-bundestag.de/unsere-politik/fachtexte/fraktionsvorstandsbeschluss-menschen-in-stadt-und-land-vor-extremer-hitze-schuetzen/
- European Commission, F-gas legislation: https://climate.ec.europa.eu/eu-action/fluorinated-greenhouse-gases/f-gas-legislation_en
- International Energy Agency, The Future of Heat Pumps: https://www.iea.org/reports/the-future-of-heat-pumps/executive-summary
- International Energy Agency, The Future of Cooling: https://www.iea.org/reports/the-future-of-cooling
Comments
Comments are powered by GitHub Discussions. You can read without signing in; posting requires a GitHub account.